TỔNG HỢP BÀI MẪU DẠNG PIE CHART – IELTS WRITING TASK 1 SAMPLE
Mục lục
Tham khảo một số IELTS Writing Task 1 sample dạng Pie Chart bên dưới và luyện viết thường xuyên nha!
IELTS Writing Task 1 sample – Topic 1
|
Model answer:
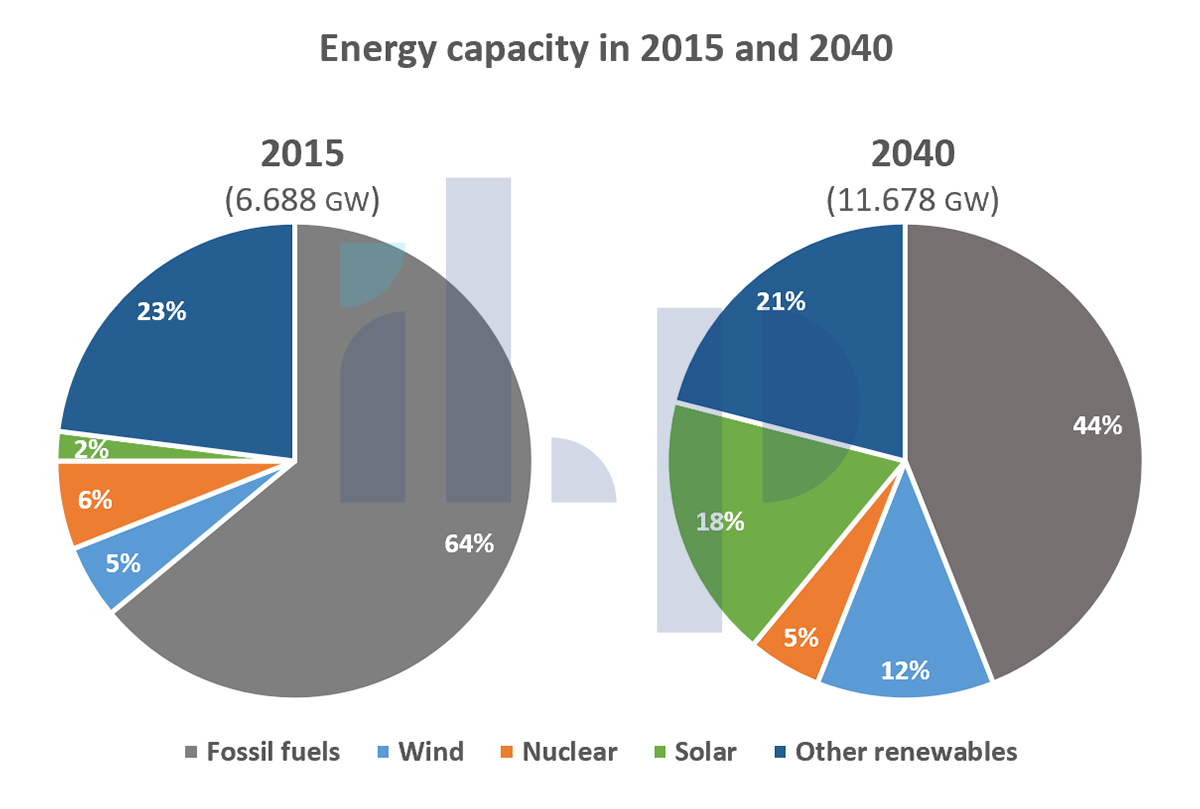
The charts show the expected changes in energy capacity in 2040 compared to 2015. Overall, it is clear that despite the decline in the proportion of energy capacity from fossil fuels and the rise in solar and wind sources, the former will remain a major energy source in 2040.
The most noticeable feature is the drop in the proportion of the annual gross capacity of fossil fuels, with the projected capacity almost doubling from 6.688 to 11.678 gigawatts. It is expected to experience a significant decline, falling from 64% in 2015 to 44% in 2040. By contrast, it is predicted that there will be a dramatic rise in the proportion of energy capacity from solar energy with a jump from 2% to 18% in 2040. While the proportion of the capacity for wind is anticipated to increase more than twofold from 5% in 2015 to 12% in 2040, it is estimated that other renewables will account for a smaller proportion with a decrease from 23% to 21%. The projected proportion for nuclear energy will be 5% in 2040, a slight decline from 6%.
IELTS Writing Task 1 sample – Topic 2
|

Model answer:
The pie charts show the numbers and percentages of men and women in both full-time and part-time employment in the UK in 1988 and 2012. Overall, we can see that all numbers increased but there were significant differences in the proportions for each year.
Firstly, although the number of men in full-time employment was largest in both years, the greatest change was in the number of women working full-time. This increased from 4,482,000 in 1988 to 7,696,000 in 2012. These changes can be seen in the percentages of the total workforce; in 1988, women in full-time employment made up only 19% of working people, but this increased to 26% in 2012. Similar to the number of people working full-time, the number of people working part-time also increased, with women being the largest number in both years: 5,268,000 and 5,979,000, compared with 1,550,000 and 2,131,000 for men.
IELTS Writing Task 1 sample – Topic 3
|
Model answer:
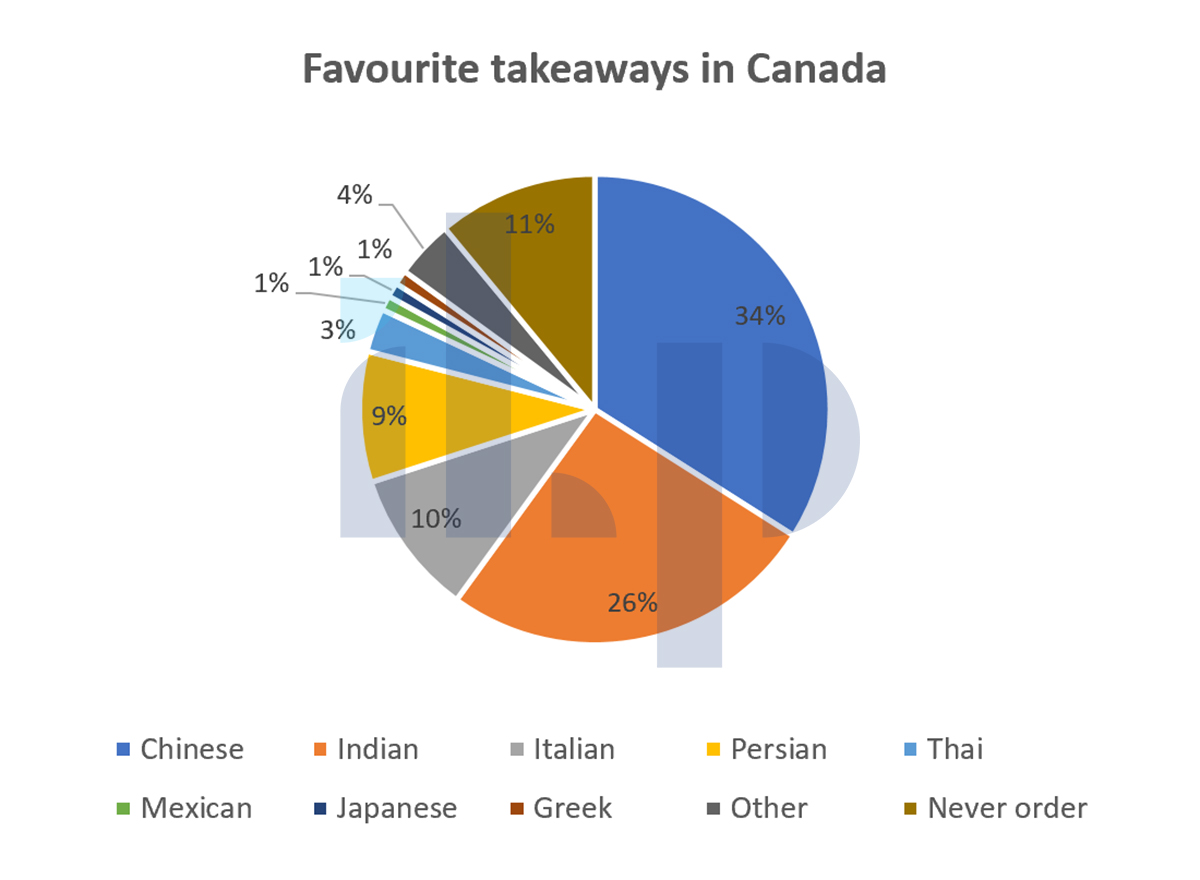
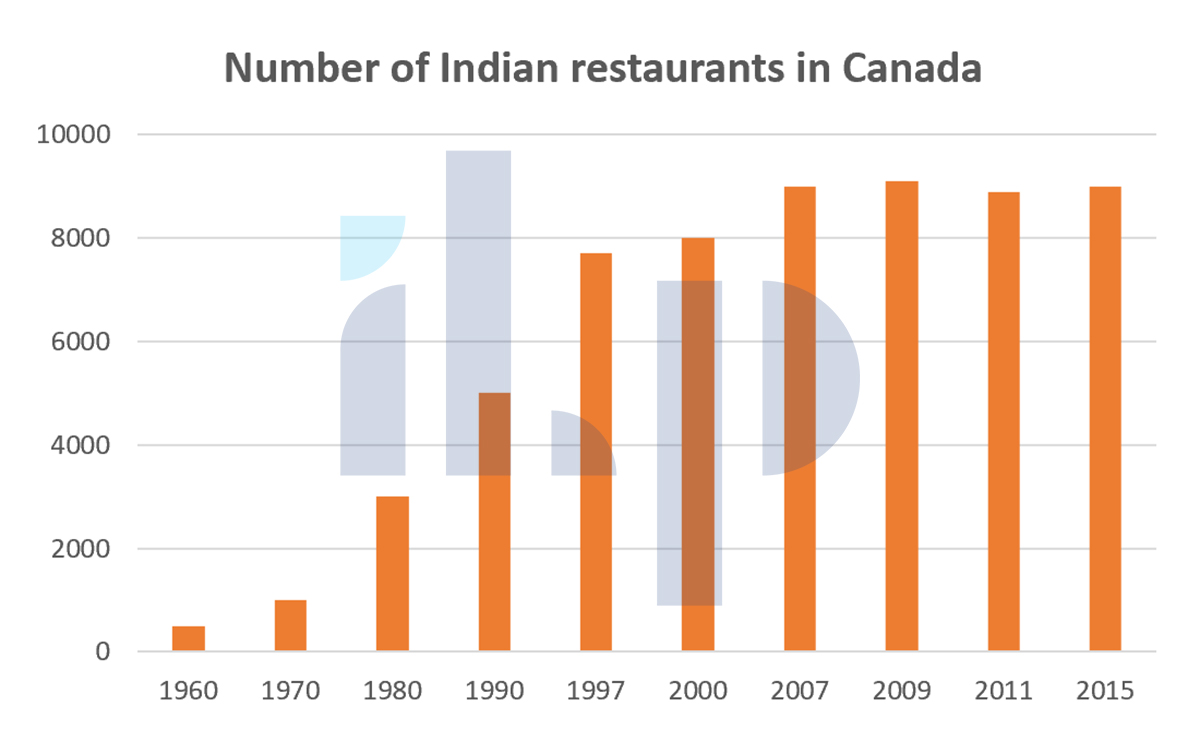
The pie chart shows which type of takeaway food is the most popular in Canada, while the bar chart shows how many Indian restaurants existed in Canada between 1960 and 2015. In general, We can see that Chinese and Indian takeaways are the favorites, and that the number of Indian restaurants in Canada rose steadily during this period.
The pie chart shows that Chinese and Indian takeaways are much more popular than all the others, at 34% and 26%. There are another two types that quite a lot of people like. These are Italian at 10% and Persian at 9%. Greek, Japanese and Mexican were only chosen by 1% of people.
The pie chart shows us that Indian food is popular and the bar chart shows how its popularity grew. There was a rising trend from 1960 onwards. The increase was greatest in the 1990s, from about 5000 restaurants in 1990 to almost 8000 in 2000. Since 2007, the number has remained stable at just over 9000.
IELTS Writing Task 1 sample – Topic 4
|
Model answer:
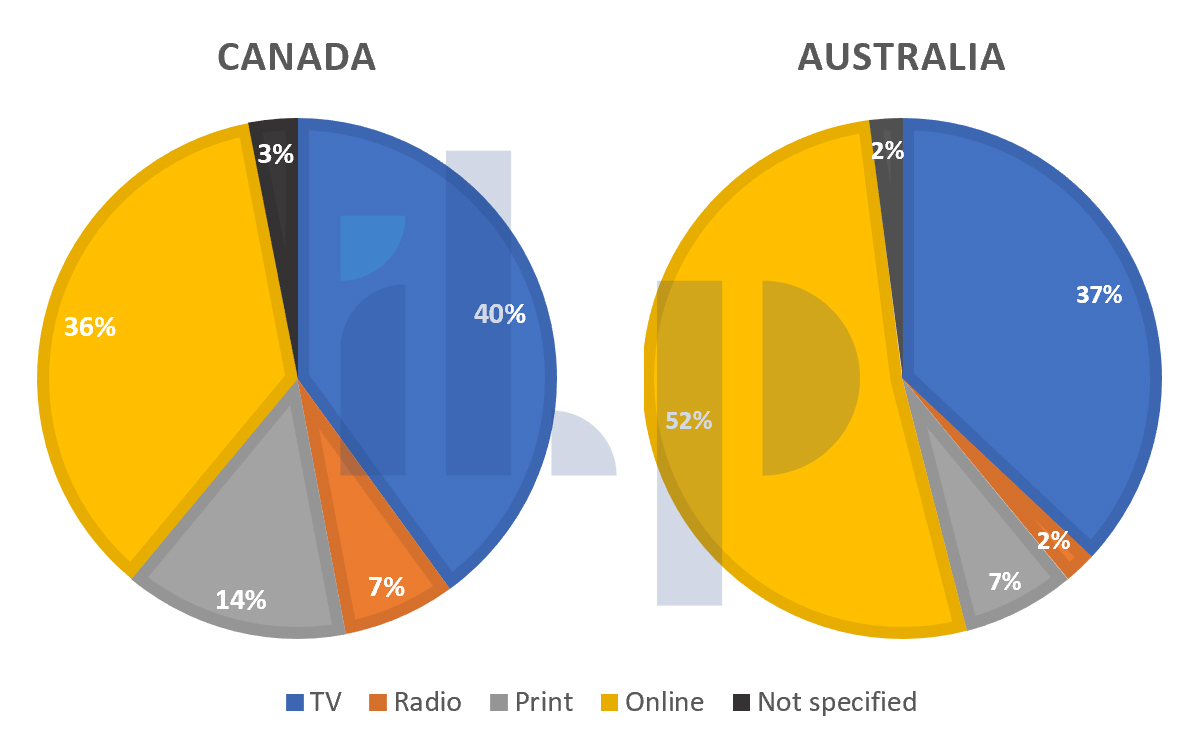
The pie charts show the principle ways of finding out the news in two different countries, Canada and Australia. The two nations show broadly similar patterns, though there are some differences, both significant and minor. Overall, it can be said that the high levels of internet use in Australia mean that other methods such as radio and print are used less in comparison with Canada.
One of the most prominent features of this data is that, while in Canada over a third of people access the news online, in Australia the figure is more than half, at 52%. It is apparent that viewing the TV news is popular in both countries, with about two fifths of the Canadian population favouring this mode of delivery and only 3% fewer in Australia.
One major difference between Canada and Australia is that over twice as many people read the news in print in the former, compared with the latter. The figures are 14% and 7% respectively. Similarly, listening to the news on the radio is preferred by three times more people in Canada than in Australia.
IELTS Writing Task 1 sample – Topic 5
|
Model answer:
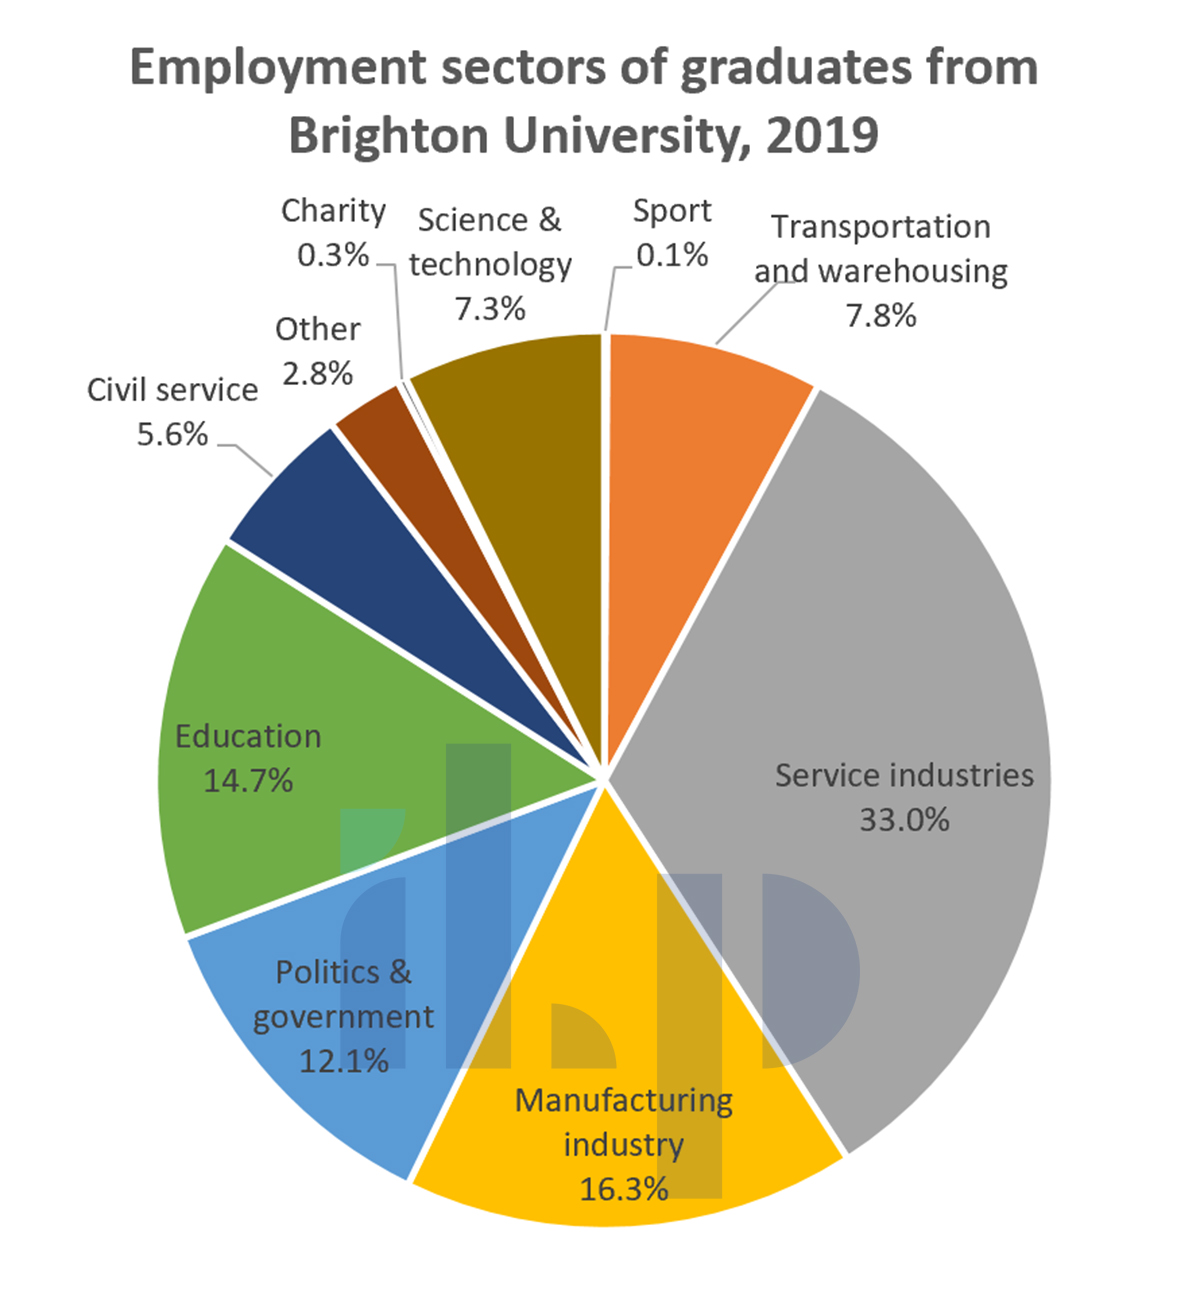
The pie chart illustrates the career choices of Brighton University’s 2019 graduates, giving the percentages who worked in each of various sectors after finishing university. It can be seen genrally that overwhelmingly, industry and government were the most popular choices.
Just under half the students went into industry, with service industries attracting more Brighton graduates than any other sector by far — almost a third (33.0%). About half that number (16.3%) took jobs in manufacturing.
Politics and public service were the next most popular choice, accounting for nearly a fifth of graduates. Just over 12% went into politics and a further 5.6% chose the civil service. The other significant career choices were education (about 15%) and two others: transportation and warehousing, with 7.8%; and science and technology with 7.3%.
The least popular choices included work in the charitable sector and careers in sport, both of which were chosen by well under 1% of graduates. Finally, 2.8% entered work in other, unspecified, sectors.
Khóa học Luyện viết tiếng Anh chuyên sâu – Writing Mindset Mastery tại ILP
Khóa học tập trung giúp các bạn học sinh cấp THCS, THPT và Sinh viên Đại học làm quen với lối tư duy tiếng Anh học thuật, xây dựng nền tảng, có tầm nhìn tổng quan, hiểu rõ nguyên lý và thông thạo việc viết tiếng Anh học thuật và viết tiếng Anh trong bài thi chuẩn hóa ngôn ngữ quốc tế như IELTS Academic & General Training, TOEFL iBT hay PTE Academic.
Tham khảo thông tin chi tiết và nhận tư vấn ngay tại đây.
Tham khảo thêm bài mẫu nè:
BÀI MẪU IELTS WRITING TASK 2 BAND 7.5+ CHỦ ĐỀ SHOPPING MALLS
BÀI MẪU SPEAKING IELTS PART 2 BAND 6.5 – 7.0: SUCCESSFUL FAMILY MEMBER
BÀI MẪU WRITING TASK 2: MUSIC IS A GOOD WAY OF BRINGING PEOPLE OF DIFFERENT CULTURES