ĐỀ WRITING TASK 1 CHÍNH THỨC – UPDATED 2021 ILP TỔNG HỢP

Mục lục
Để thực hiện tốt phần thi Writing Task 1 thì bên cạnh việc nắm vững lý thuyết, các bạn còn phải có một quá trình luyện viết chuyên sâu và phải ôn luyện hết các dạng bài thi.
Trong bài viết này, Thầy sẽ tổng hợp đề thi IELTS Writing Task 1 của tất cả các dạng bài để bạn có thể ôn luyện một cách có hệ thống và mang lại hiệu quả cao nhất.
Đề IELTS Writing Task 1 – Dạng bài Pie Chart
Pie Chart (biểu đồ tròn) là thường xuyên xuất hiện trong phần thi Writing Task 1.
Để biết được các bước viết Pie Chart step-by-step, các bạn có thể tham khảo thêm bài viết sau:
Các bước viết dạng bài Pie Chart – Step By Step
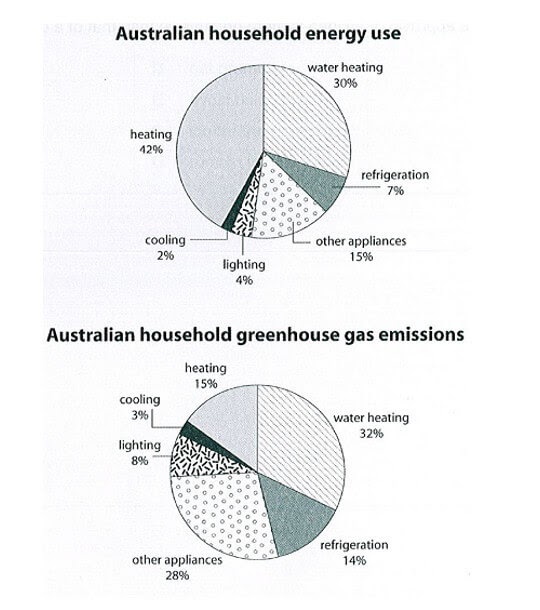
Dạng bài Pie Chart – Đề Writing Task 1 số 1
| The first chart below shows how energy is used in an average Australian household. The second chart shows the greenhouse gas emissions which result from this energy use. |
Dạng bài Pie Chart – Đề Writing Task 1 số 2
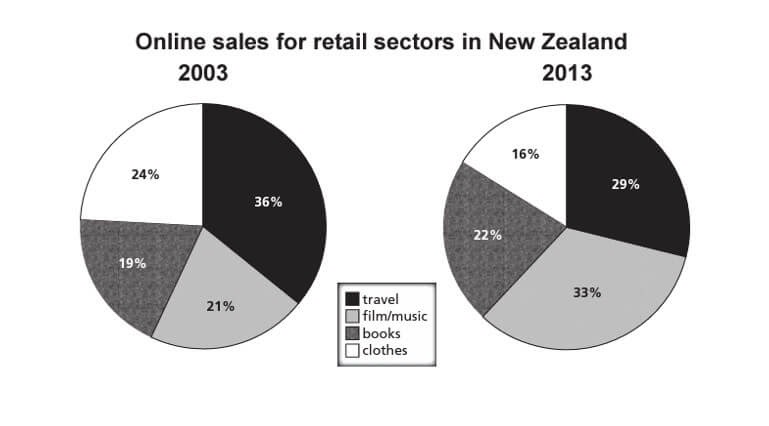
| The pie charts below show the online shopping sales for retail sectors in New Zealand in 2003 and 2013. |
Dạng Bài Pie Chart – Đề Writing Task 1 số 3
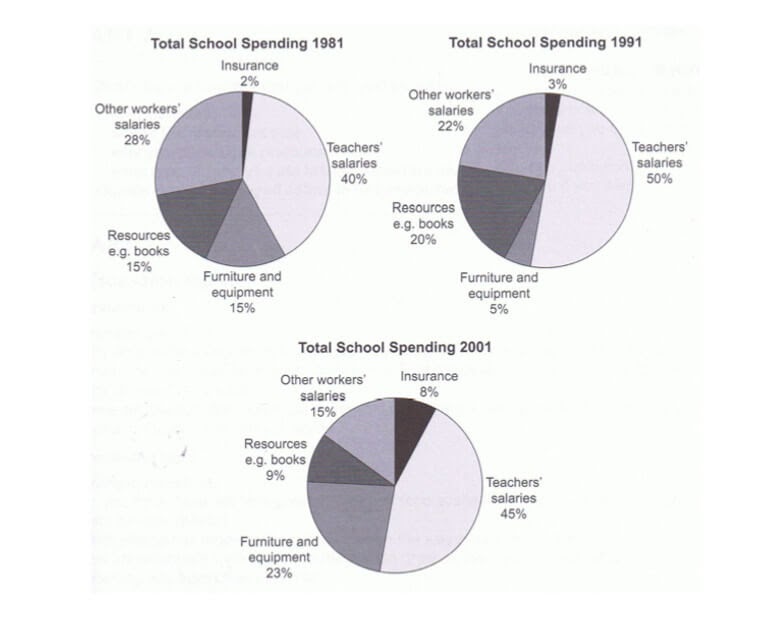
| The three charts below show the changes in annual spending by a particular UK school in 1981, 1992, and 2001. |
Dạng bài Pie Chart – Đề Writing Task 1 số 4
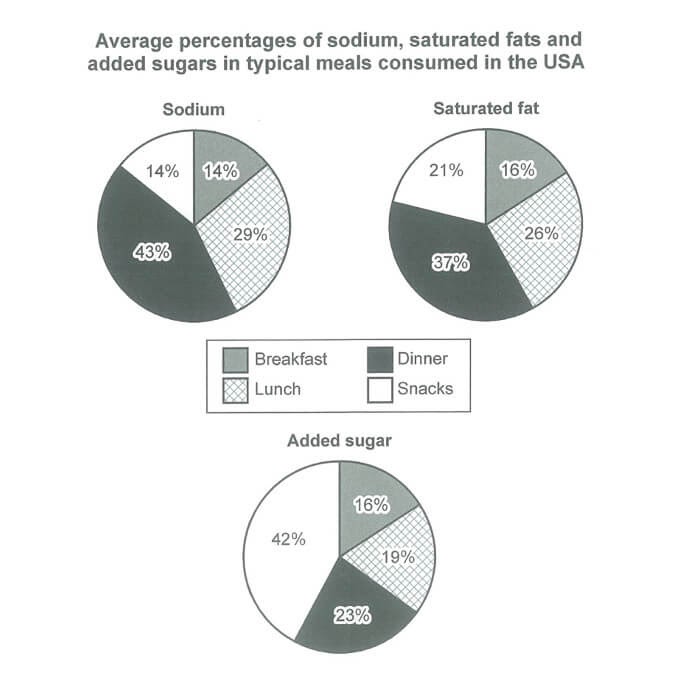
| The charts below show the average percentages in typical meals of three types of nutrients, all of which may be unhealthy if eaten too much. |
Dạng bài Pie Chart – Đề Writing Task 1 số 5
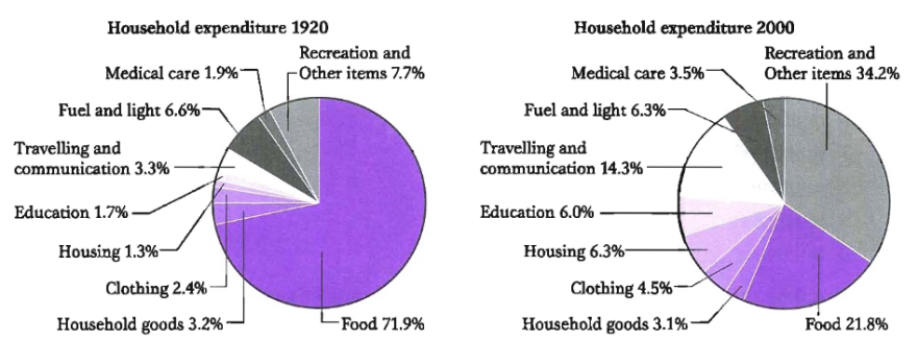
| The two pie charts show the average spending of households in a country at two different points in its economic development. |
Dạng bài Pie Chart – Đề Writing Task 1 số 6
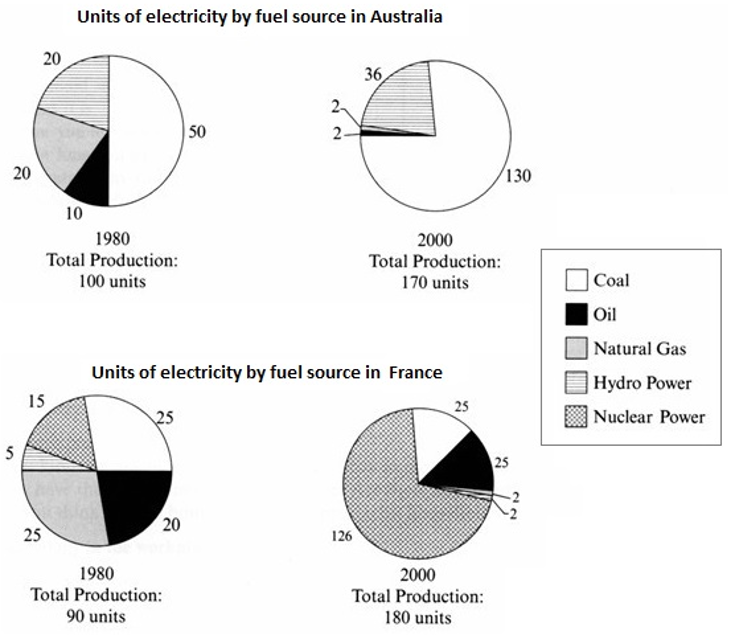
| The pie charts below show units of electricity production by fuel source in Australia and France in 2980 and 2000. |
Dạng bài Pie Chart – Đề Writing Task 1 số 7
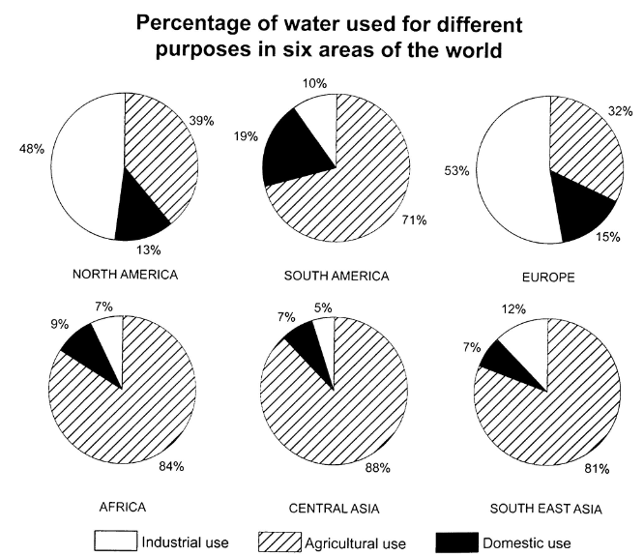
| The charts below show the percentage of water used for different purposes in six areas of the world. |
Đề IELTS Writing Task 1 – Dạng bài Bar Chart
Có tần suất xuất hiện tương tự như biểu đồ tròn, Bar Chart (biểu đồ cột) cũng là dạng bài bạn thường gặp trong phần thi Writing Task 1.
Để biết được các bước viết Bar Chart step-by-step, các bạn có thể tham khảo thêm bài viết sau:
Các bước viết dạng bài Bar Chart – Step By Step
Dạng bài Bar Chart – Đề Writing Task 1 số 1
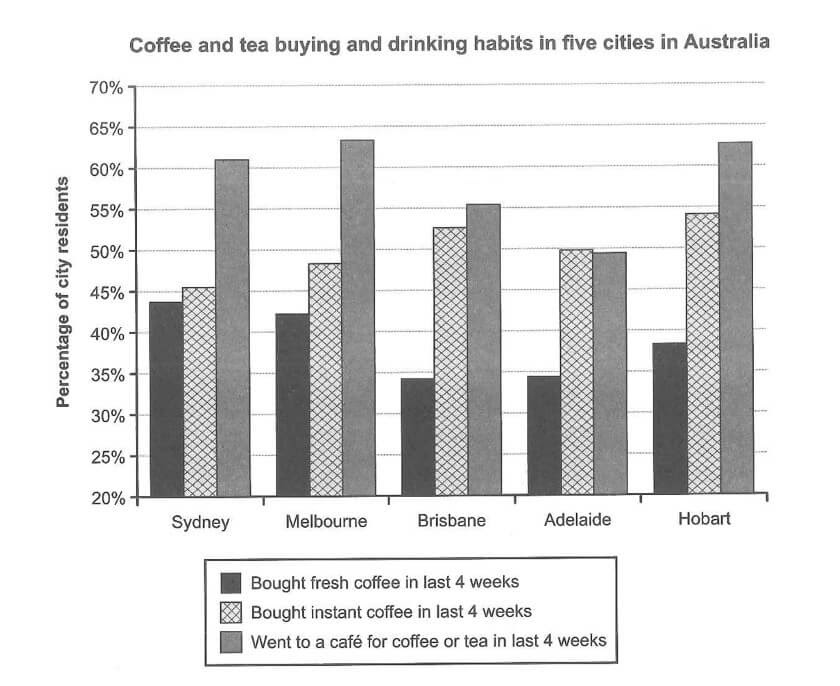
| The chart below shows the results of a survey about people’s coffee and tea buying and drinking habits in five Australian cities. |
Dạng bài Bar Chart – Đề Writing task 1 số 2
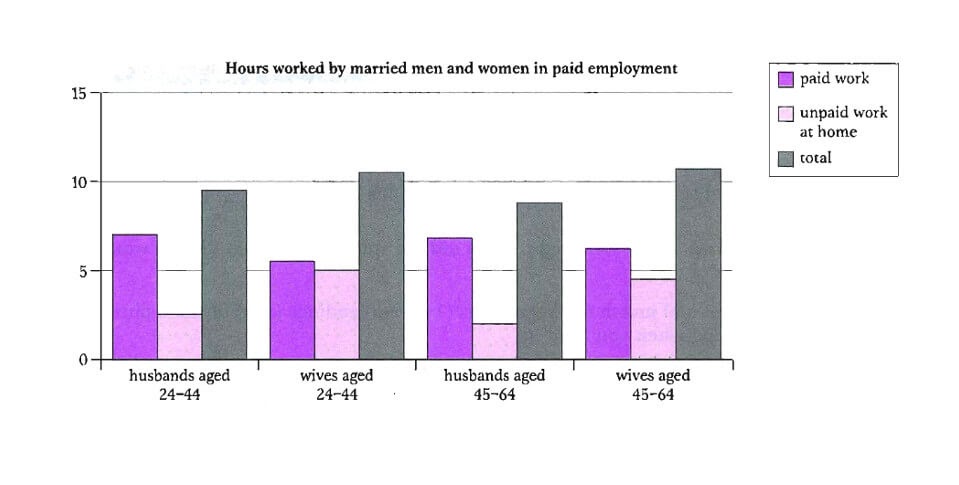
| The chart below shows the average hours worked per day by married men and women in paid employment. |
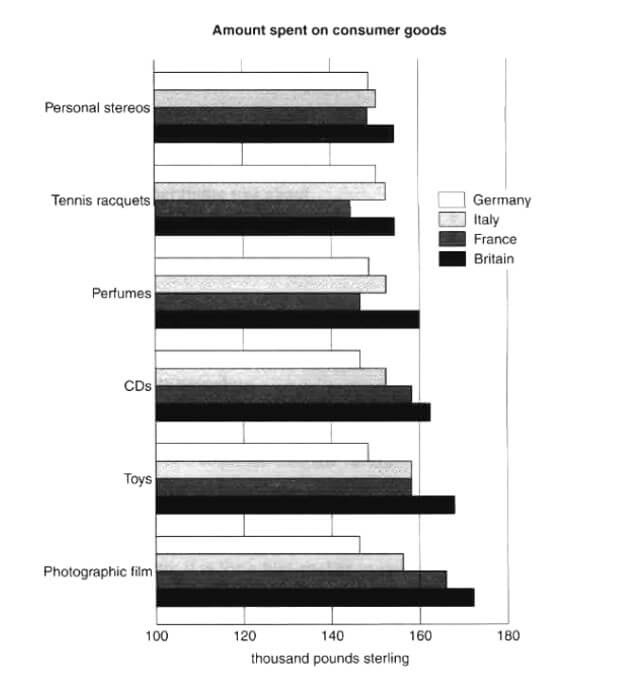
Dạng bài Bar Chart – Đề Writing Task 1 số 3
|
The chart below shows the amount spent on six consumer goods in four European countries. |
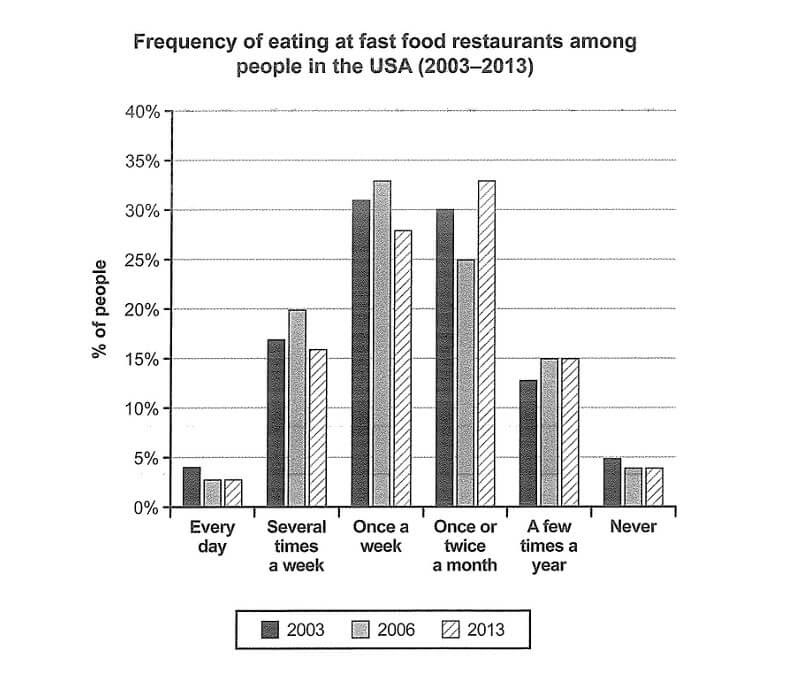
Dạng bài Bar Chart – Đề Writing Task 1 số 4
| The chart below shows how frequent people in the USA ate in fast food restaurants between 2003 and 2013. |
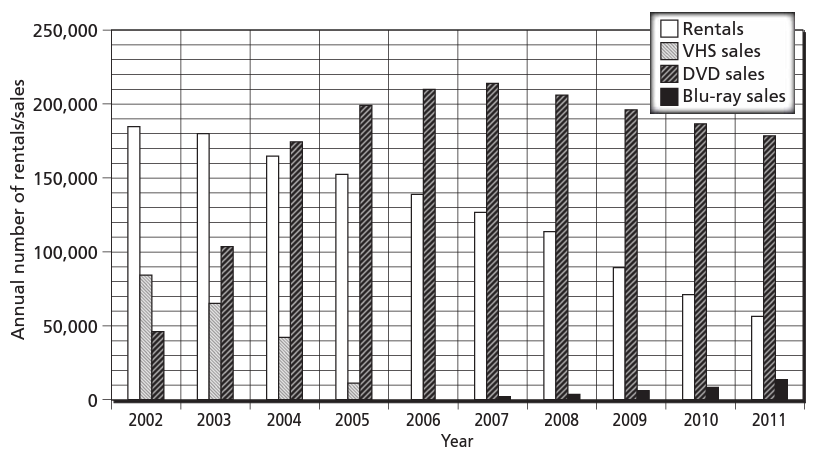
Dạng bài Bar Chart – Đề Writing Task 1 số 5
| The chart below shows the annual number of rentals and sales (in various formats) of films from a particular store between 2002 and 2011. |
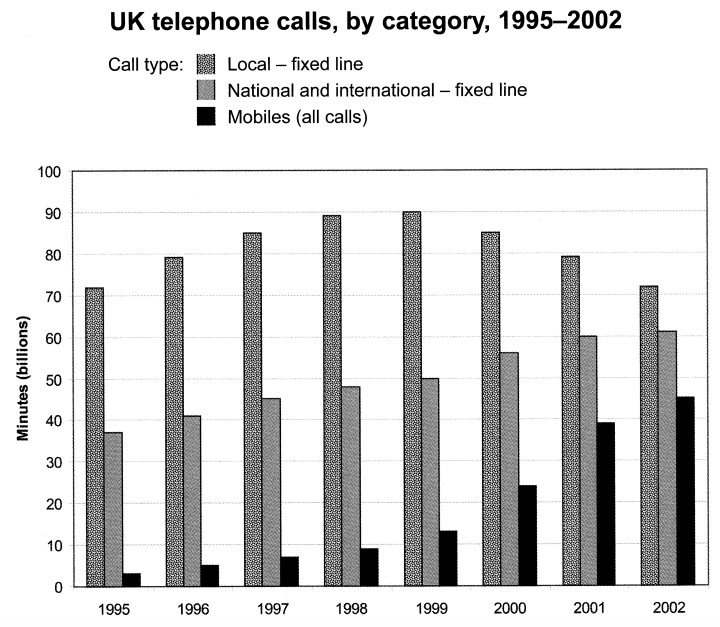
Dạng bài Bar Chart – Đề Writing Task 1 số 6
| The chart below shows the total number of minutes (in billions) of telephone calls in the UK, divided into three categories, from 1995 – 2002. |
Dạng bài Bar Chart – Đề Writing Task 1 số 7
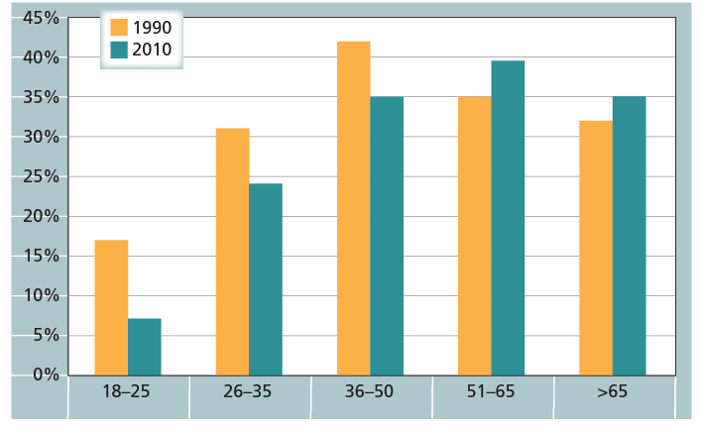
| The chart below gives information on the percentage of British people giving money to charity by age range for the years 1990 and 2010. |
Dạng bài Bar Chart – Đề Writing Task 1 số 8
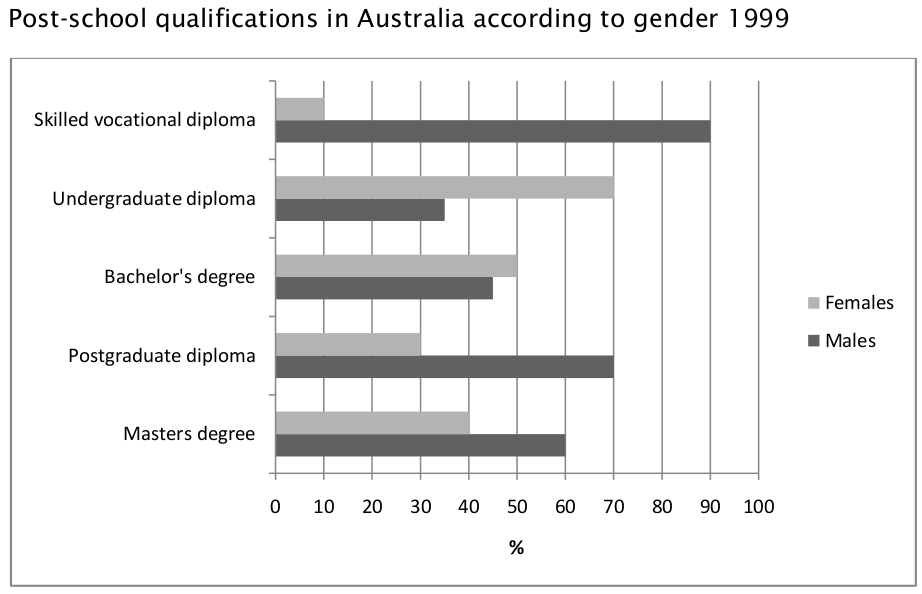
| The chart below shows the different levels of post school qualifications in Australia and the proportion of men and women who held them in 1999. |
Dạng bài Bar Chart – Đề Writing Task 1 số 9
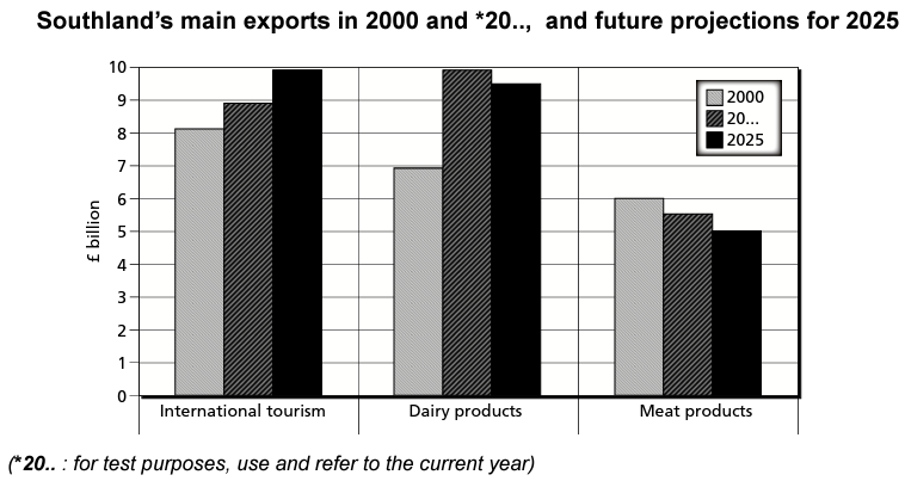
| The chart below gives information about Southland’s main exports in 2000, *20.., and future projections for 2025. |
Dạng bài Bar Chart – Đề Writing Task 1 số 10
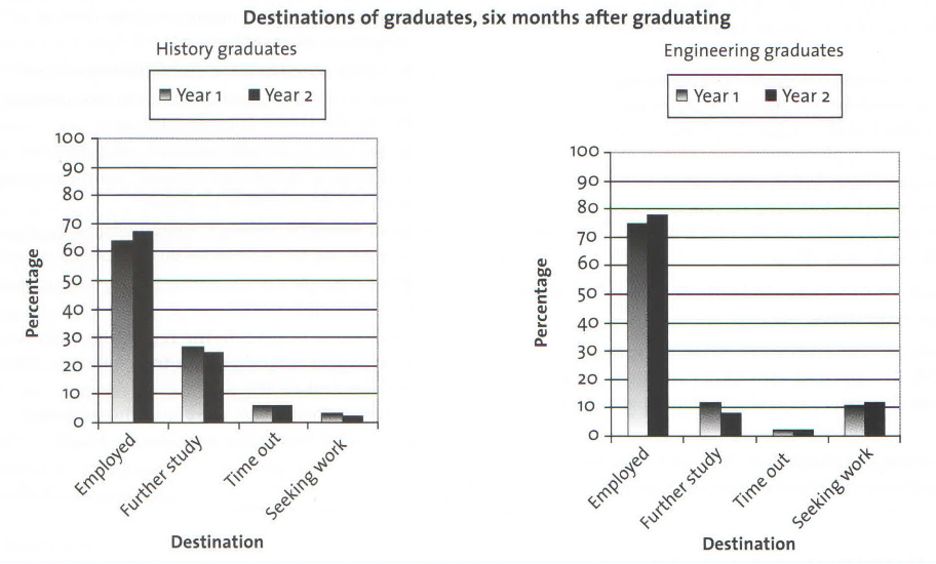
|
The charts below show what the history and engineering graduates of a particular university were doing six months after graduating. The figures cover a two-year period. |
Dạng bài Bar Chart – Đề Writing Task 1 số 11
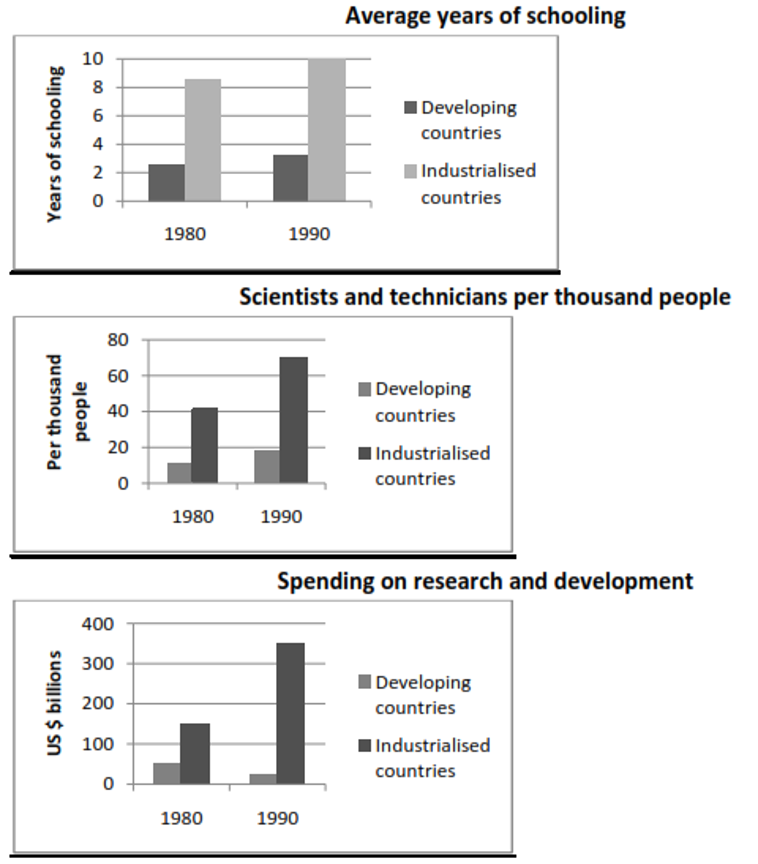
| The charts below show the levels of participation in education and science in developing and industrialised countries in 1980 and 1990. |
Đề IELTS Writing Task 1 – Dạng bài Line Graph
Một dạng bài khác cũng rất hay gặp trong phần thi Writing Task 1 là Line Graph đồ thị. Thầy cũng đã viết 01 bài chuyên sâu về các bước thực hiện dạng bài này ở bài viết sau:
Các bước viết dạng bài Line Graph – Step By Step
Dạng bài Line Graph – Đề Writing Task 1 số1
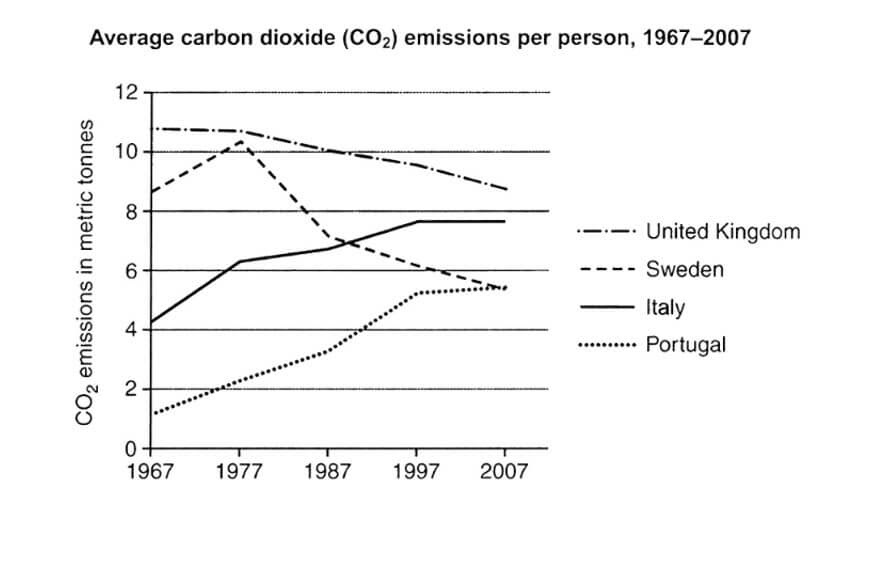
| The graph below shows average carbon dioxide emissions per person in the United Kingdom, Sweden, Italy and Portugal between 1967 and 2007. |
Dạng bài Line Graph – Đề Writing Task 1 số 2
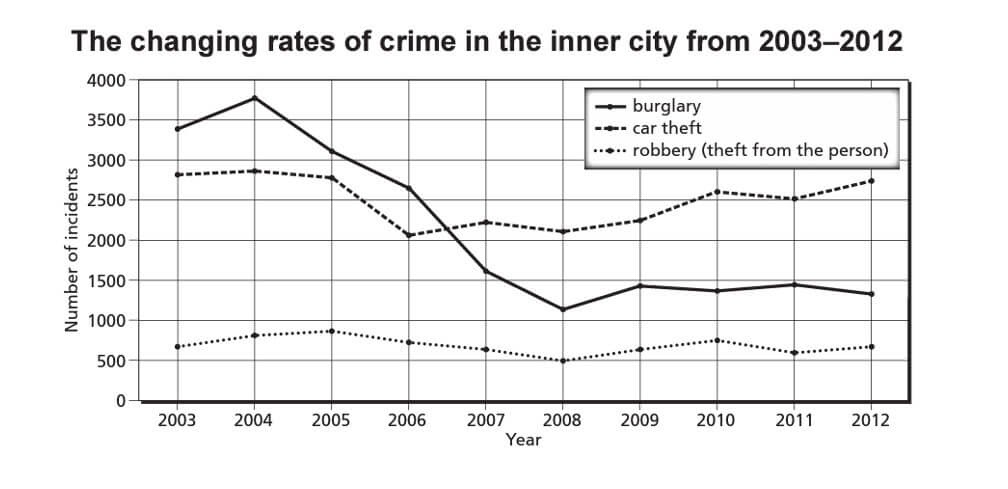
| The chart below shows the changes that took place in three different areas of crime in Newport city centre from 2003-2012. |
Dạng bài Line Graph – Đề Writing Task 1 số 3
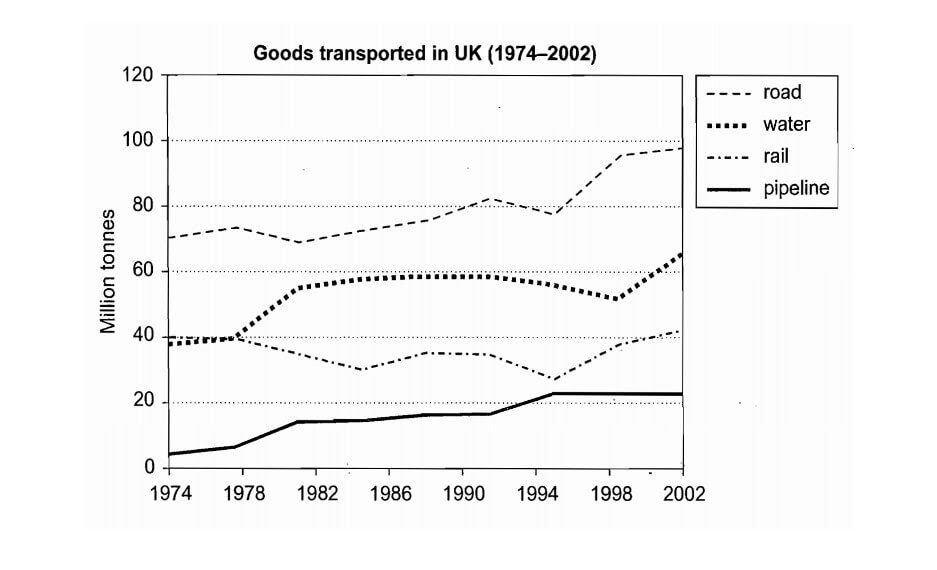
| The graph below shows the quantities of goods transported in the UK between 1974 and 2002 by four different modes of transport. |
Dạng bài Line Graph – Đề Writing Task 1 số 4
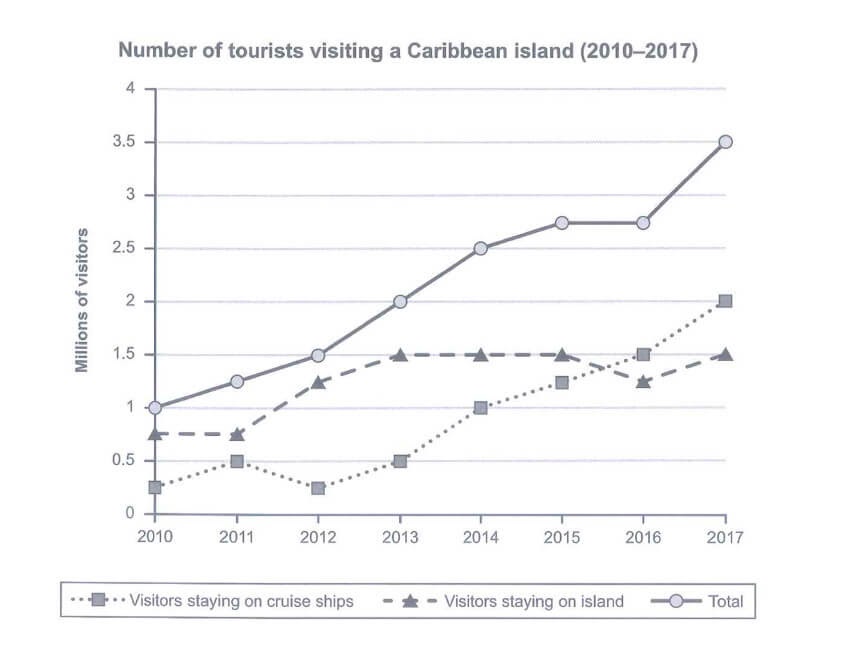
| The graph below shows the number of tourists visiting a particular Caribbean island between 2010 and 2017. |
Dạng bài Line Graph – Đề Writing Task 1 số 5
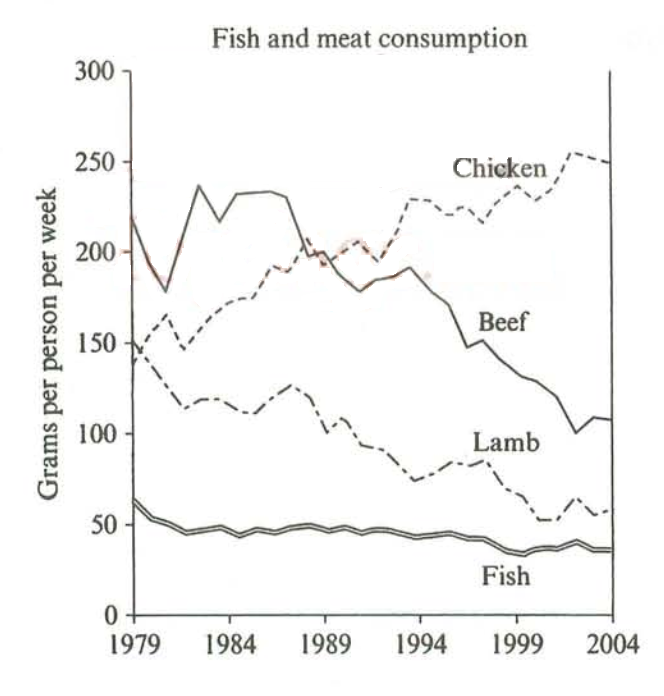
| The graph below shows the consumption of fish and some different kinds of meat in a European country between 2979 and 2004. |
Dạng bài Line Graph – Đề Writing Task 1 số 6
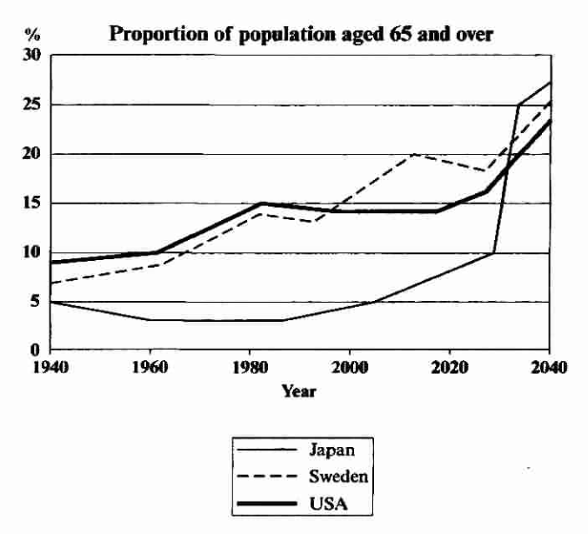
| The graph below shows the proposition of the population aged 65 and over between 1940 and 2040 in three different countries. |
Dạng bài Line Graph – Đề Writing Task 1 số 7
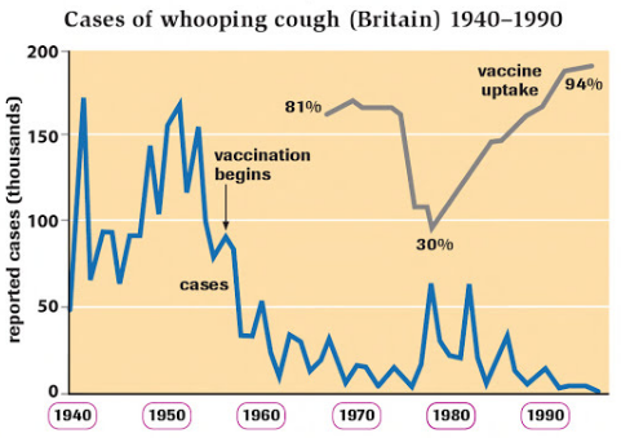
| The graph shows the impact of vaccinations on the incidence of whooping cough, a child illness, between 1940 and 1990 in Britain. |
Dạng bài Line Graph – Đề Writing Task 1 số 8
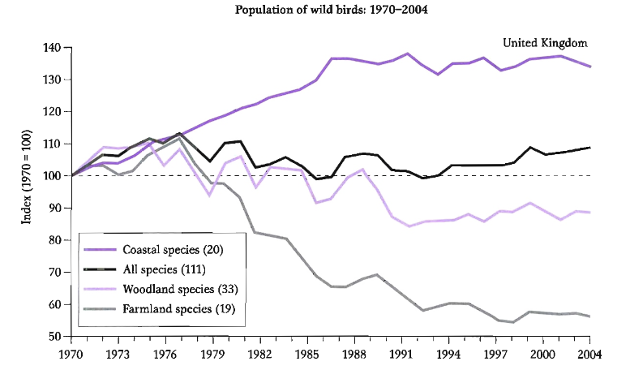
|
The graph below shows the population figures of different types of wild birds in the United Kingdom between 1970 and 2004. |
Dạng bài Line Graph – Đề Writing Task 1 số 9
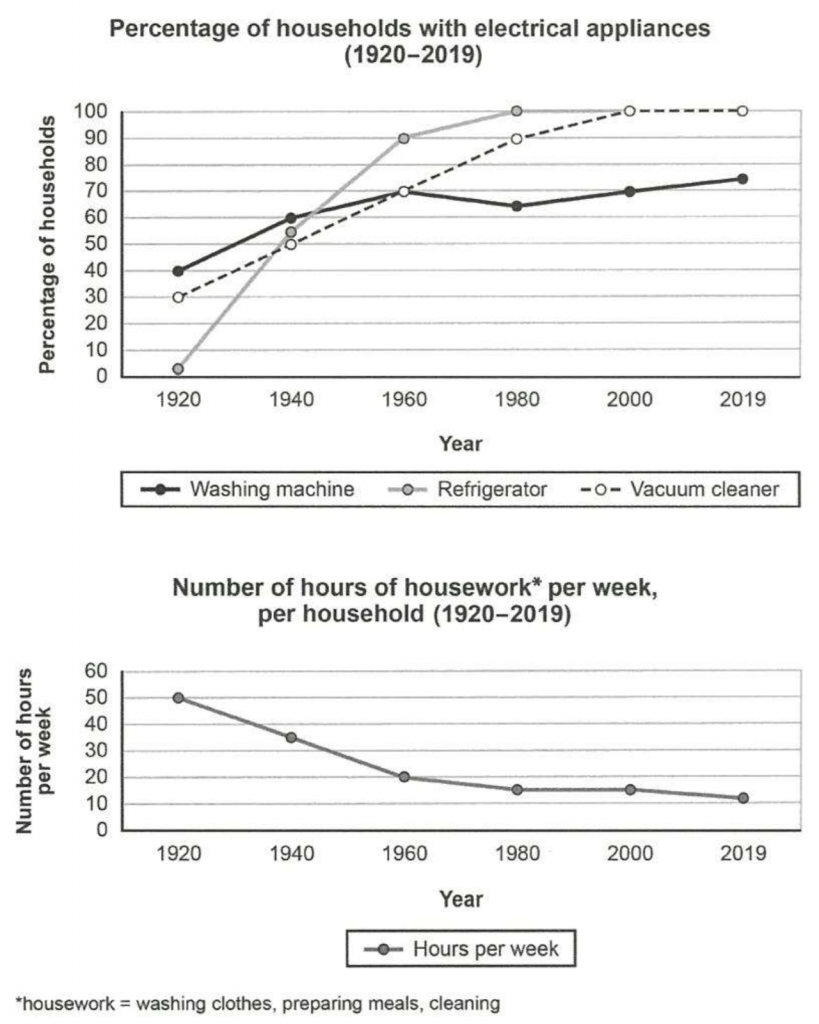
|
The charts below show the changes in ownership of electrical appliances and amount of time spent doing housework in households in one country between 1920 and 2019. |
Đề IELTS Writing Task 1 – Dạng bài Table
Dạng bài Tables (bảng số liệu) có tần suất xuất hiện ít hơn các dạng bài trên những nguyên lý thực hiện cũng không khác biệt quá nhiều. Bạn có thể tham khảo các bước thực hiện ở bài viết sau:
Các bước viết dạng bài Table – Step By Step
Dạng bài Table – Đề Writing Task 1 số 1
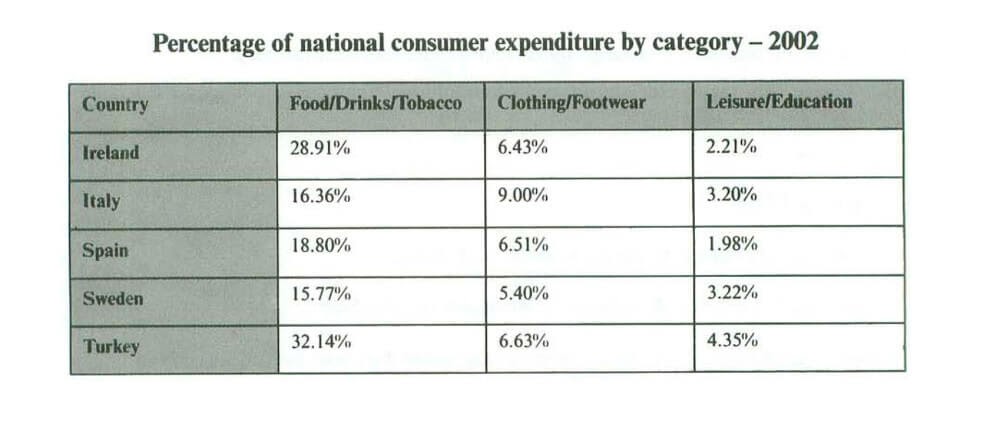
| The table below gives information on consumers spending on different items i five different countries in 2002 |
Dạng bài Table – Đề Writing Task 1 số 2
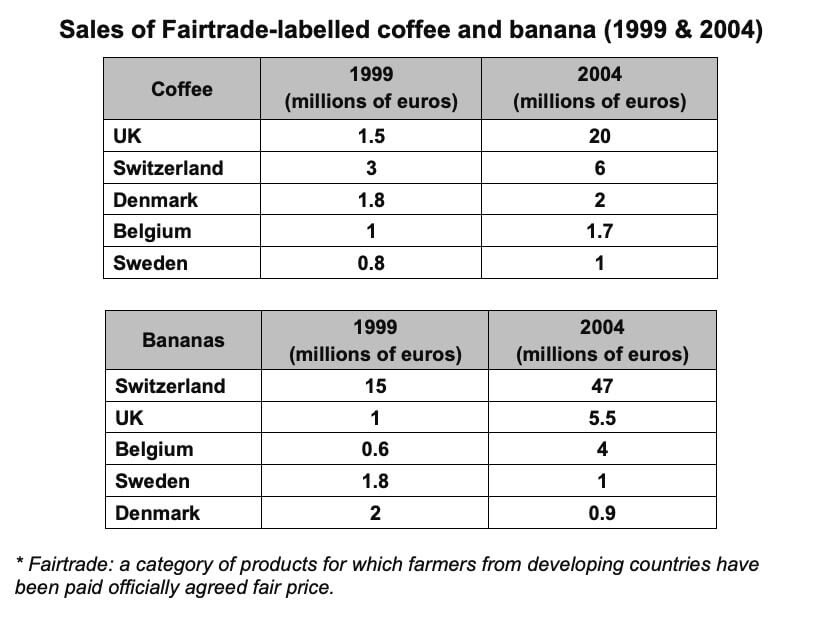
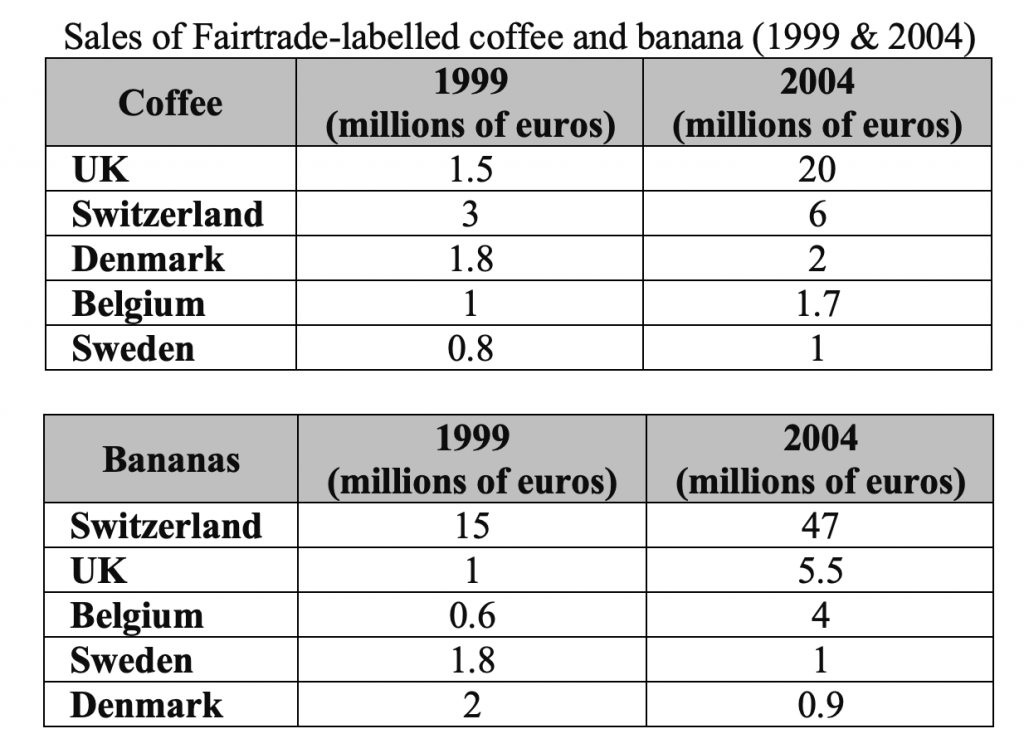
| The tables below give information about sales of Fairtrade (*)-labelled coffee and bananas in 1999 and 2004 in five European countries. |
Dạng bài Table – Đề Writing Task 1 số 3
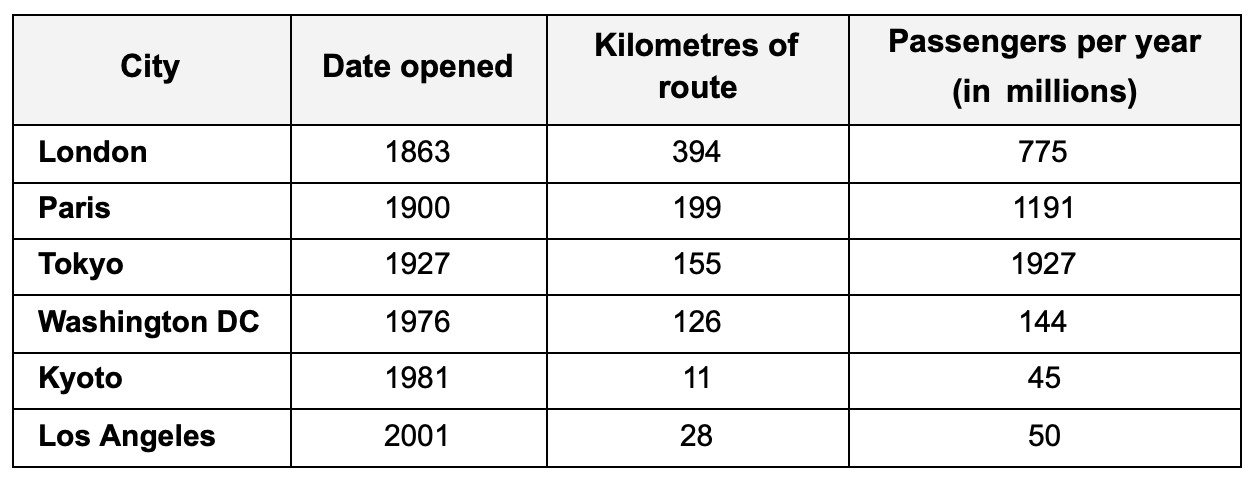
| The table gives information about the underground railway systems in six cities. |
Underground Railways Systems
Dạng bài Table – Đề Writing Task 1 số 4
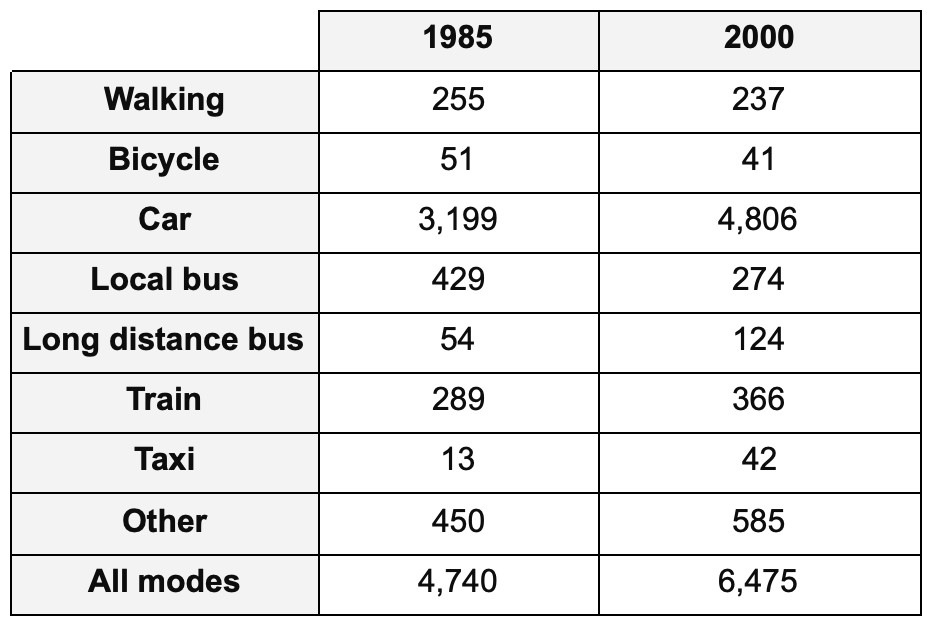
|
The table below gives information about changes in models of travel in England between 1985 and 2000. |
Average distance travelled in miles per person per year, by mode of travel
Dạng bài Table – Đề Writing Task 1 số 5
| The tables below give information about sales of Fairtrade (*)-labelled coffee and bananas in 1999 and 2004 in five European countries. |
Dạng bài Table – Đề Writing Task 1 số 6
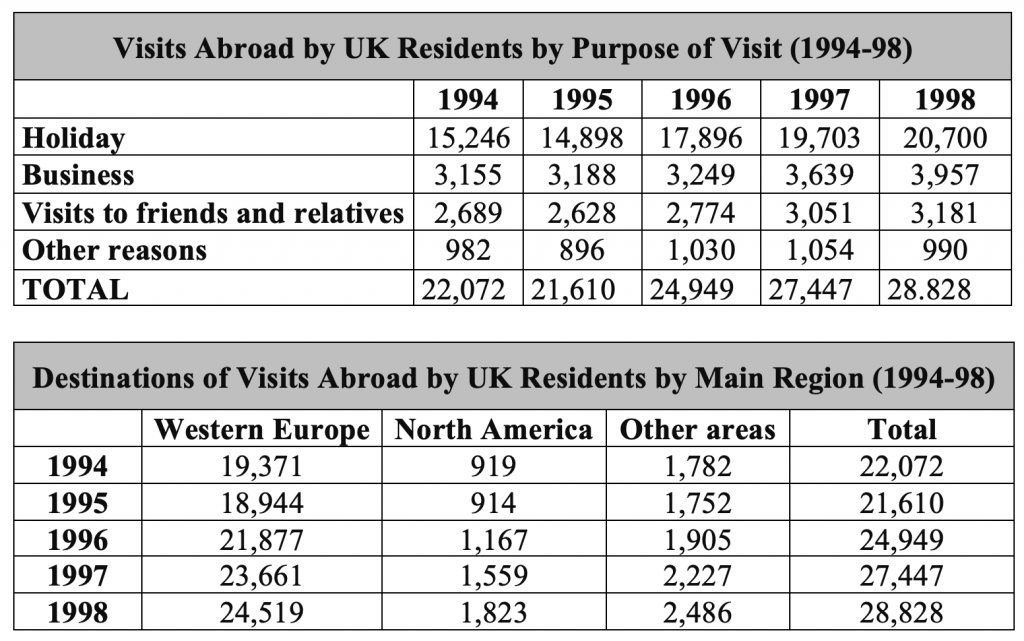
| The first chart below shows the results of a survey which sampled a cross-section of 100,000people asking if they travelled abroad and why they travelled for the period 1994-98. The second chart shows their destinations over the same period. |
Đề IELTS Writing Task 1 – Dạng bài Kết Hợp (Mixed)
Dạng bài biểu đồ kết hợp thường khiến cho nhiều học viên cảm thấy khó khăn trong việc thực hiện nhưng thực ra các bước thực hiện cũng không quá phức tạp.
Để nắm được các bước viết dạng bài này, các bạn có thể tham khảo bài viết sau:
Các bước viết dạng bài Kết Hợp – Step By Step
Dạng bài Kết Hợp (Mixed) – Đề Writing Task 1 số 1
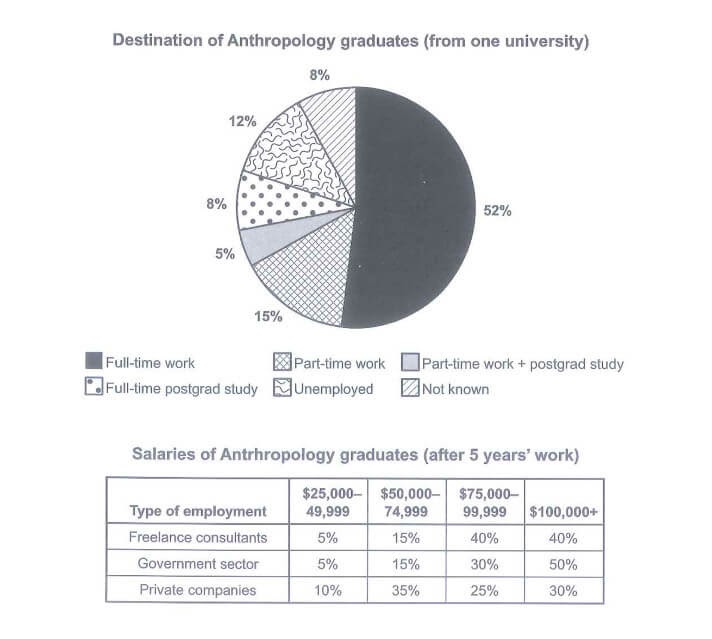
| The chart below shows what Anthropology graduates from one university did after finishing their undergraduate degree course. The table shows the salaries of the anthropologists in work after five years. |
Dạng bài Kết Hợp (Mixed) – ĐềWriting Task 1 số 2
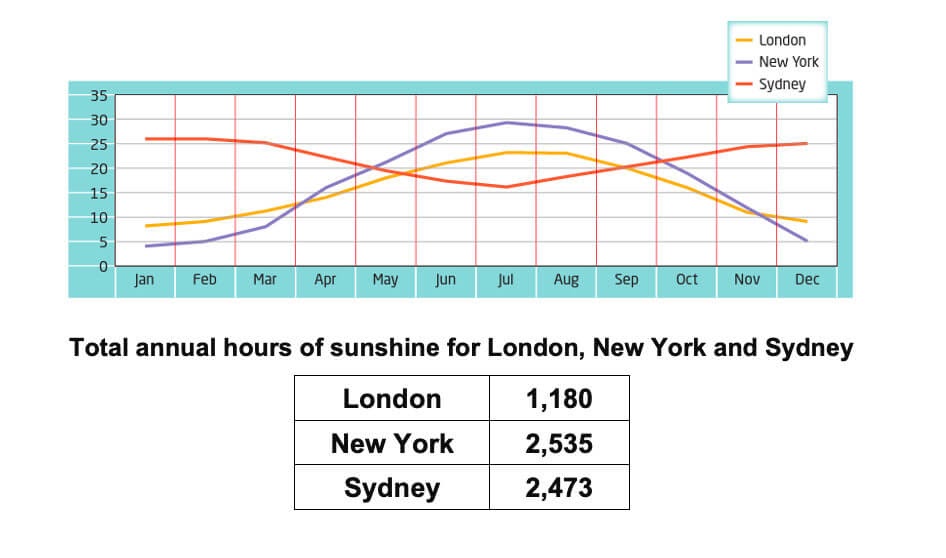
| The graph and table below show the average monthly temperatures and the average number of hours of sunshine per year in three major cities. |
Dạng bài Kết Hợp (Mixed) – Đề Writing Task 1 số 3
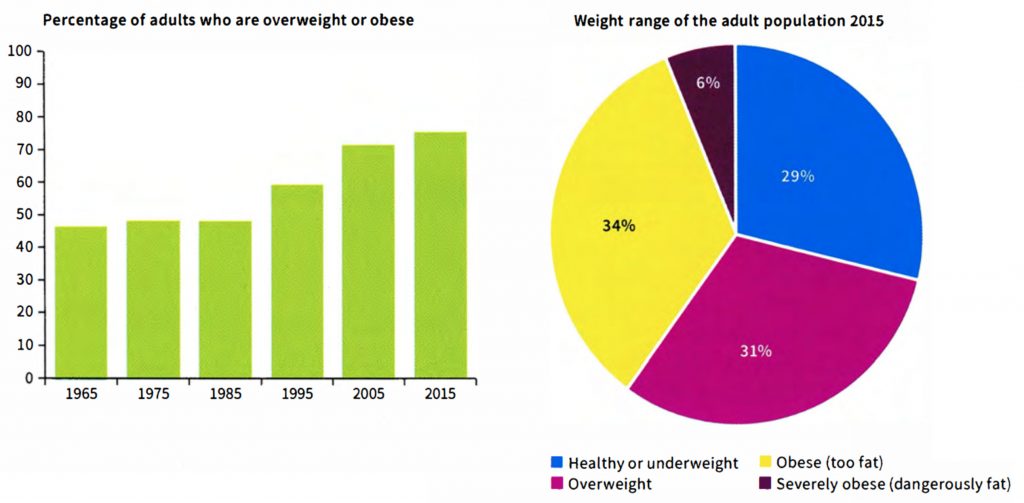
|
The bar chart shows the percentage of adults who were overweight or obese (too fat or much too fat) in one country from 1965 to 2015. The pie chart shows the proportion of adults who were overweight, obese or severely obese in 2015. |
Dạng bài Kết Hợp (Mixed) – Đề Writing Task 1 số 4
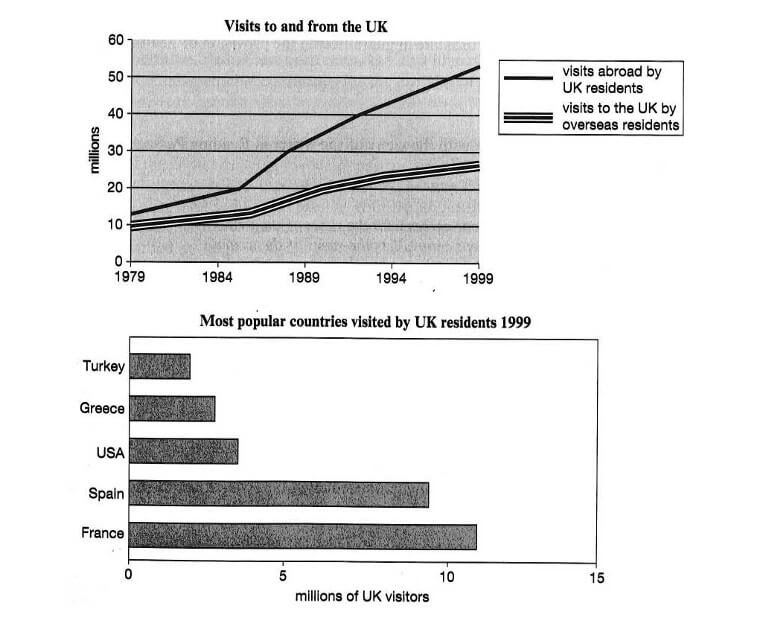
| The charts below give information about travel to and from the UK, and about the most popular countries for UK residents to visit. |
Dạng bài Kết Hợp (Mixed) – Đề Writing Task 1 số 5
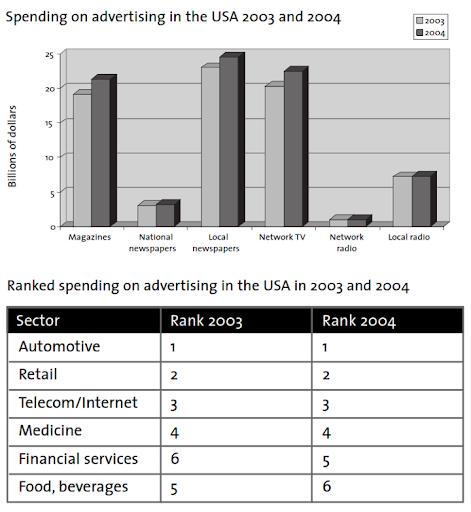
|
The bar chart below shows the amount spent on different types of advertising in the USA in 2003 and 2004. The table shows the six sectors which spent the most on advertising in the USA in 2003 and 2004. |
Dạng bài Kết Hợp (Mixed) – Đề Writing Task 1 số 6
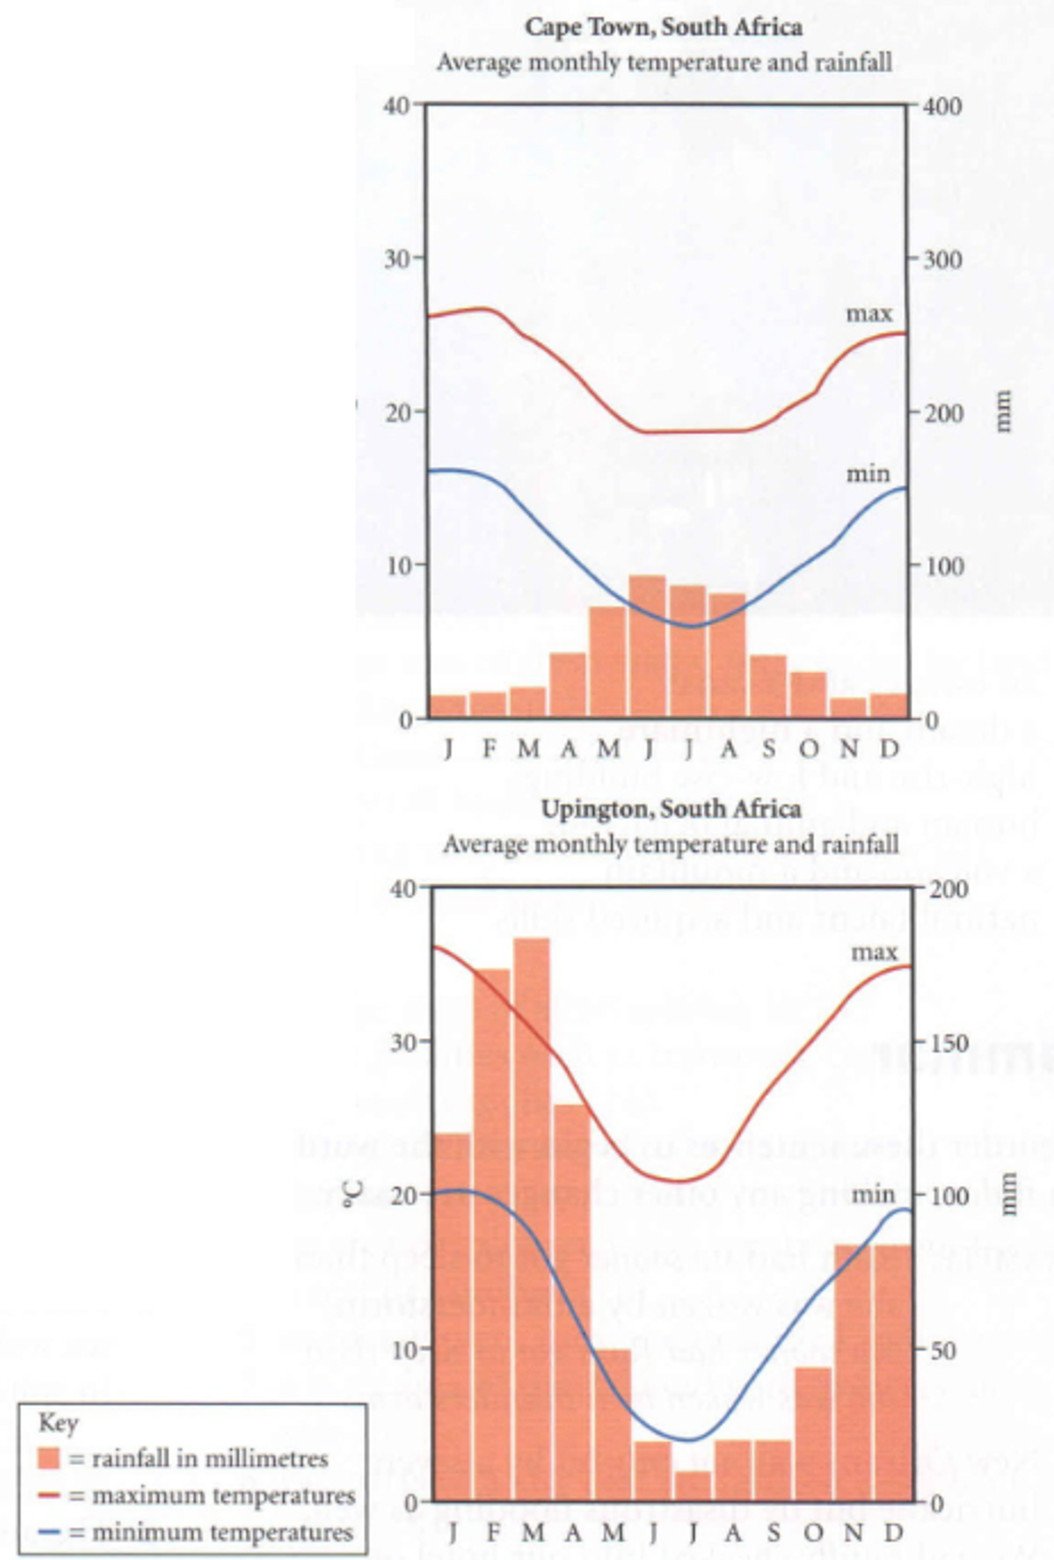
| The graphs below show average monthly temperature and rainfall in two places in South Africa. |
Dạng bài Kết Hợp (Mixed) – Đề Writing Task 1 số 7
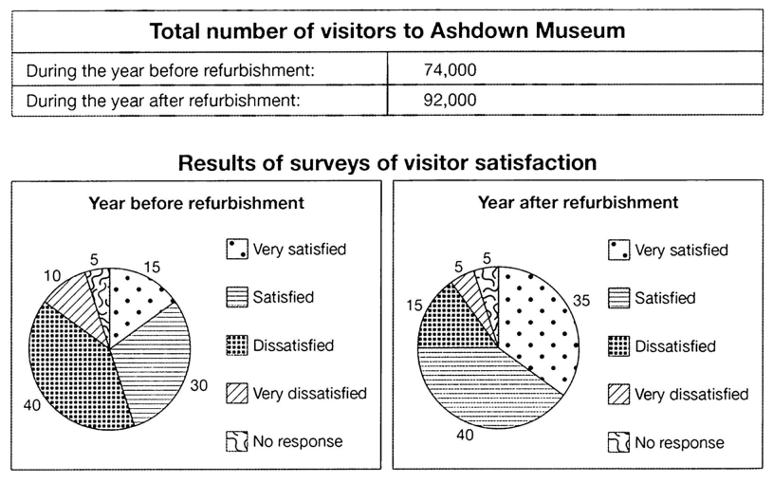
|
The table below shows the numbers of visitors to Ashdown Museum during the year before and the year it was refurbished. The charts show the result of surveys asking visitors how they were with their visit, during the same two periods. |
Dạng bài Kết Hợp (Mixed) – Đề Writing Task 1 số 8
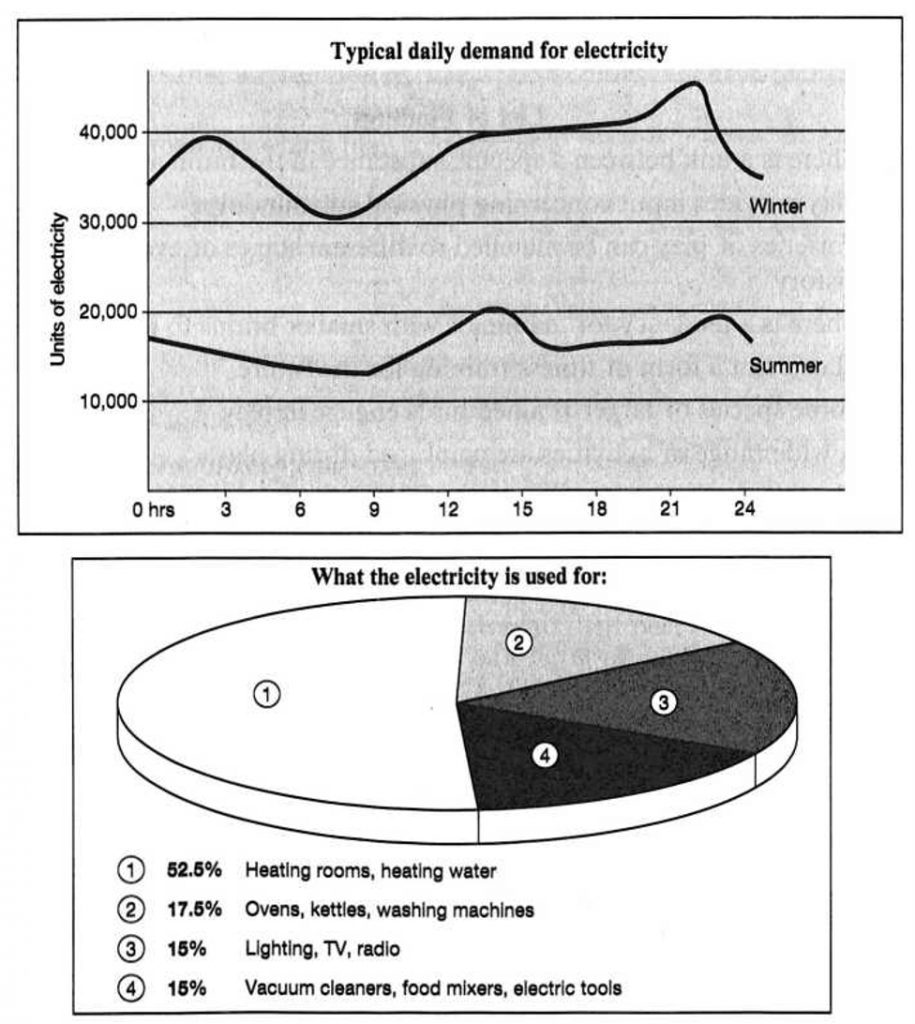
|
The graph below shows the demand for electricity in England during typical days in winter and summer. The pie chart shows how electricity is used in an average English home. |
Dạng bài Kết Hợp (Mixed) – Đề Writing Task 1 số 9
|
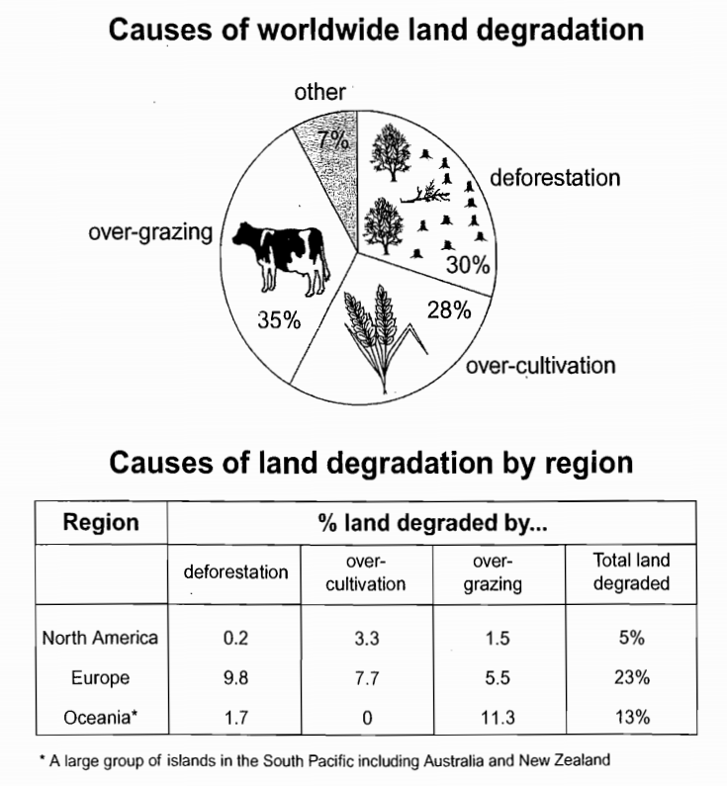
The pie chart below shows the main reasons why agricultural land becomes less productive. The table shows how these causes affected three regions of the world during the 1990s. |
Dạng bài Kết Hợp (Mixed) – Đề Writing Task 1 số 10
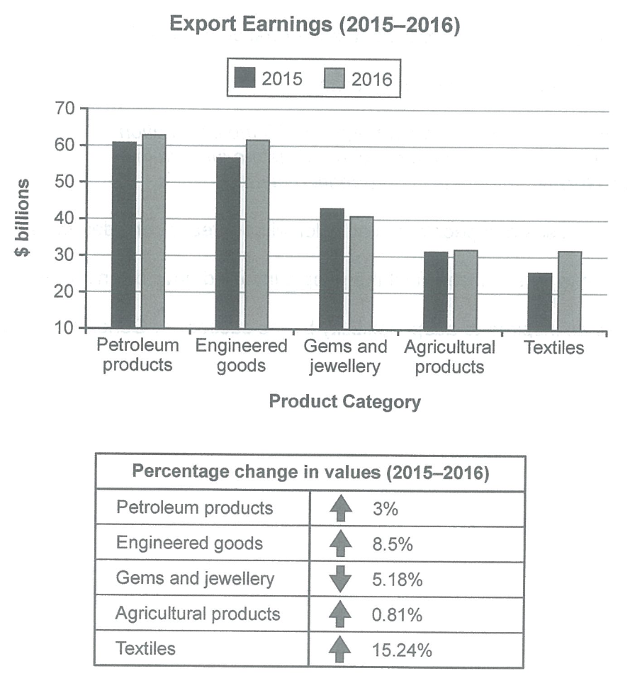
| The chart below shows the value of one country’s exports in various categories during 2015 and 2016. The table shows the percentage change of each category of exports in 2016 compared with 2015. |
Đề IELTS Writing Task 1 – Dạng bài Process
Rất nhiều bạn sợ gặp phải dạng bài Process (quá trình) trong phần thi Writing Task 1 nhưng thực ra dạng bài này cũng không phải quá khó nếu bạn nắm được nguyên lý thực hiện.
Bạn có thể tham khảo bài viết sau để biết các bước viết dạng bài Process – step by step:
Các bước viết dạng bài Process – Step By Step
Dạng bài Process – Đề số 1
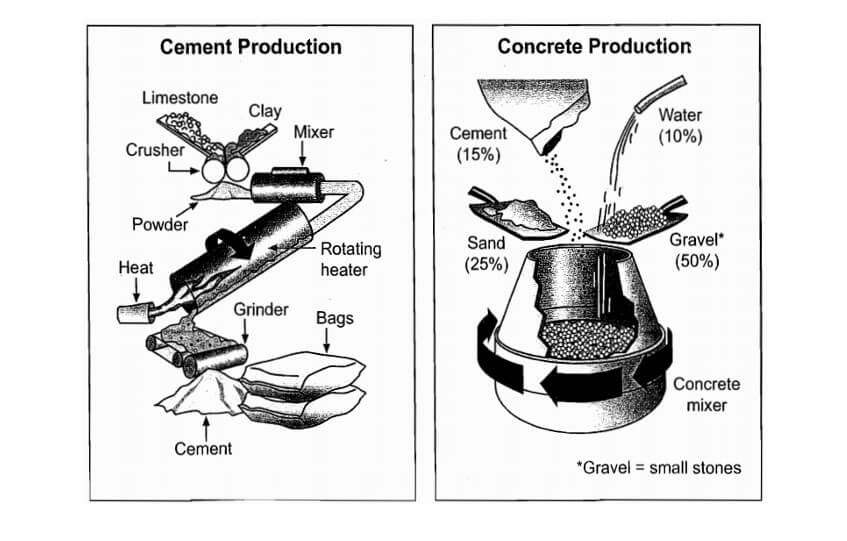
| The diagrams below show the stages and equipment used in the cement-making process, and how cement is used to produce concrete for building purposes. |
Dạng bài Process – Đề số 2
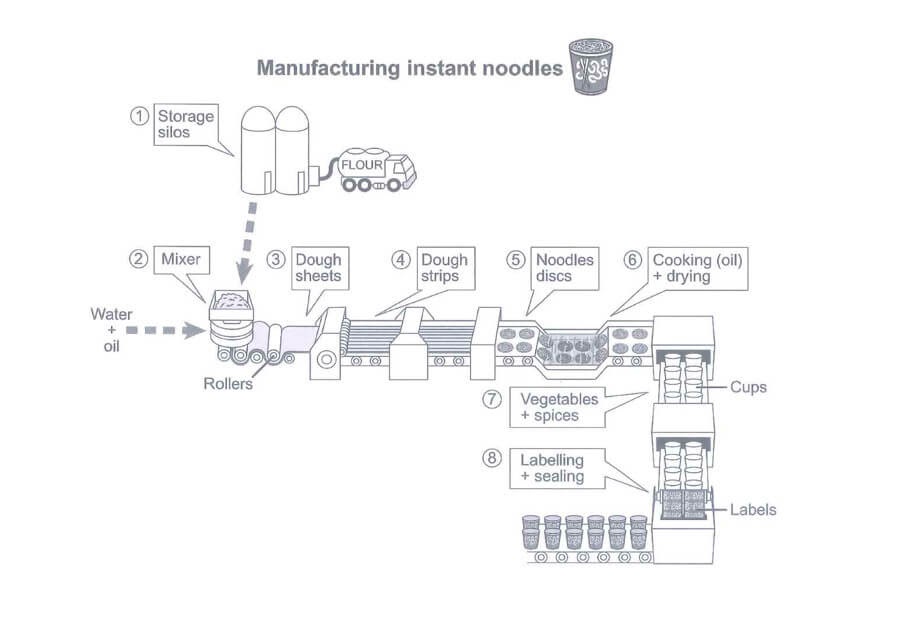
| The diagram below shows how instant noodles are manufactured. |
Dạng bài Process – Đề số 3
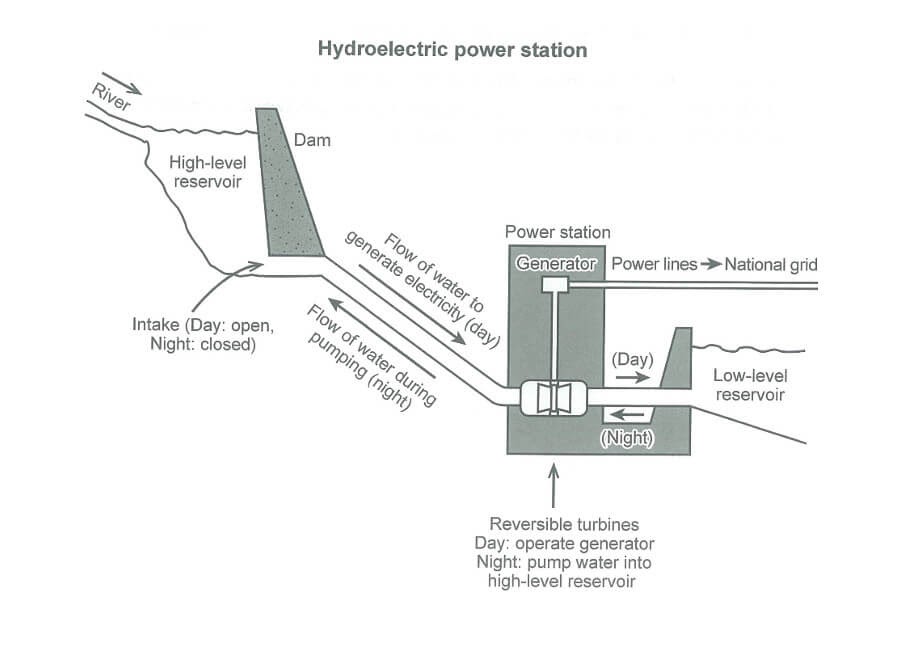
| The diagram below shows how electricity is generated in a hydroelectric power station. |
Dạng bài Process – Đề số 4
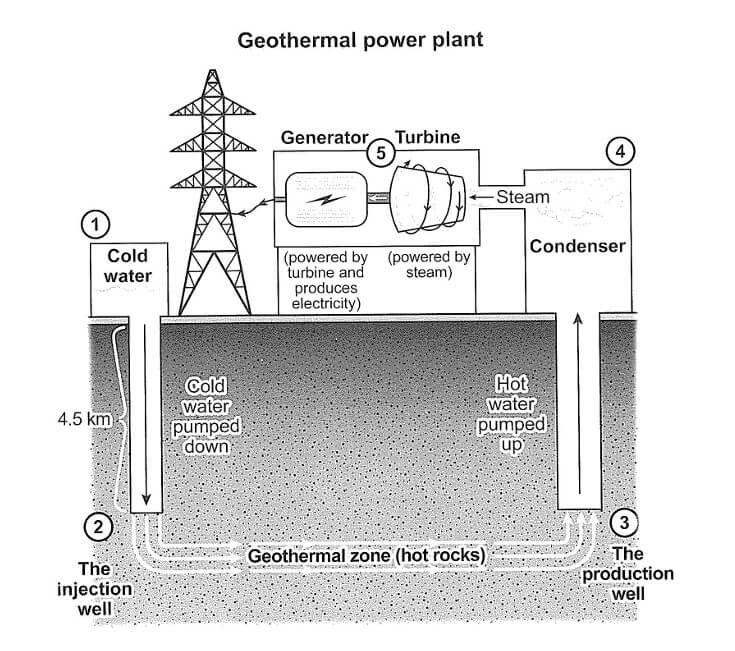
| The diagram below shows how geothermal energy is used to produce electricity. |
Dạng bài Process – Đề số 5
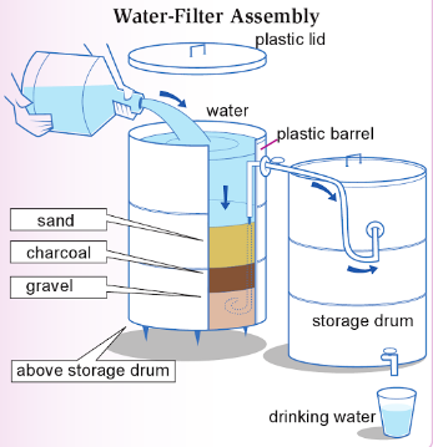
| The diagram below shows a simple system that turns dirty water into clean water. |
Dạng bài Process – Đề số 6
|
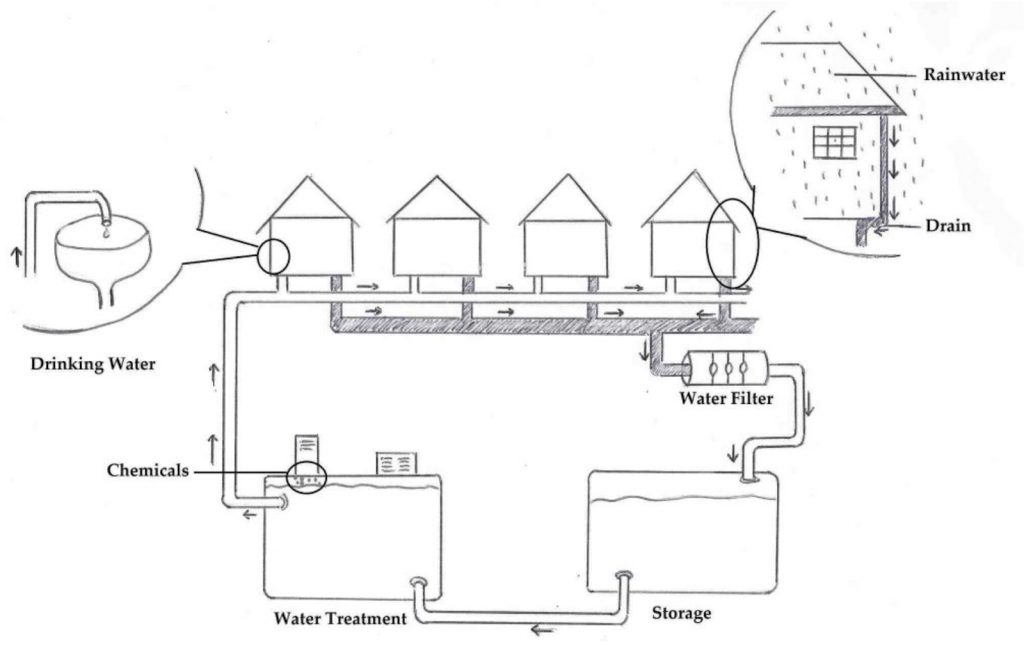
The diagram shows how rainwater is collected for the use of drinking water in an Australian town. |
Dạng bài Process – Đề số 7
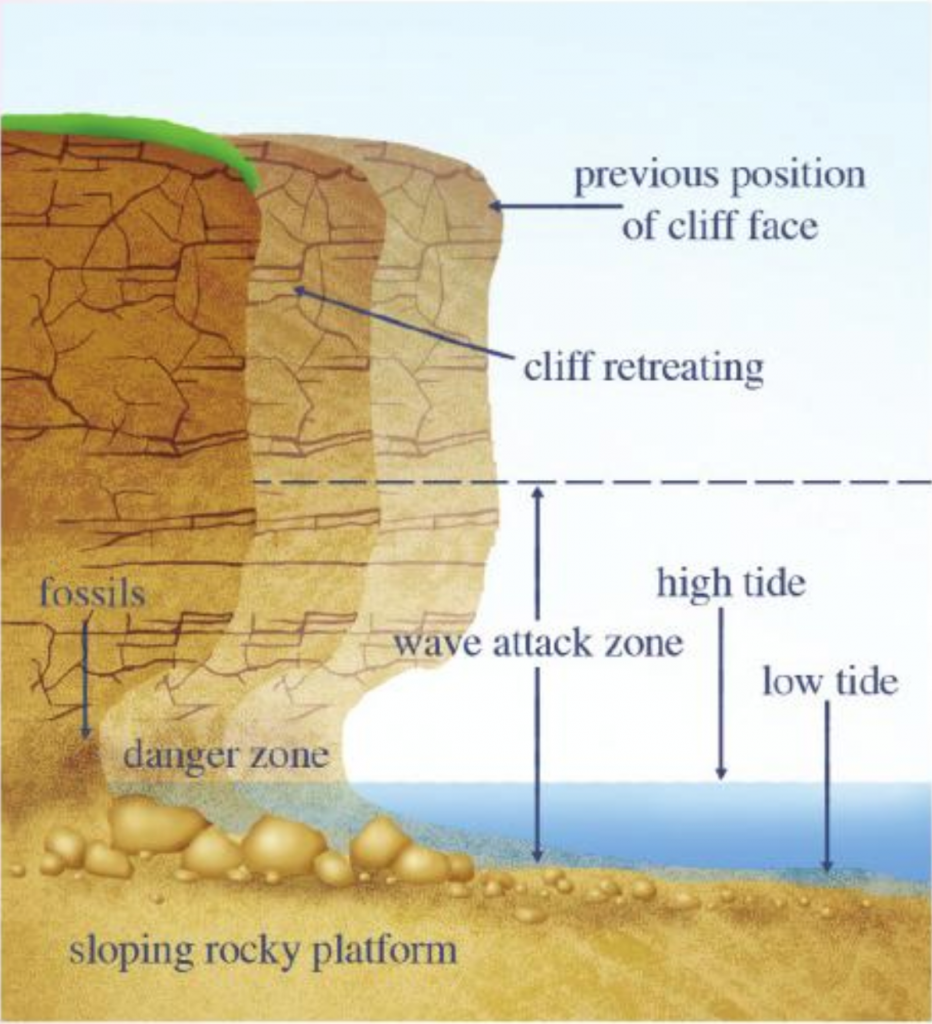
| The diagram below illustrates how fossils were exposed beneath a cliff as a result of coastal erosion. |
Dạng bài Process – Đề số 8
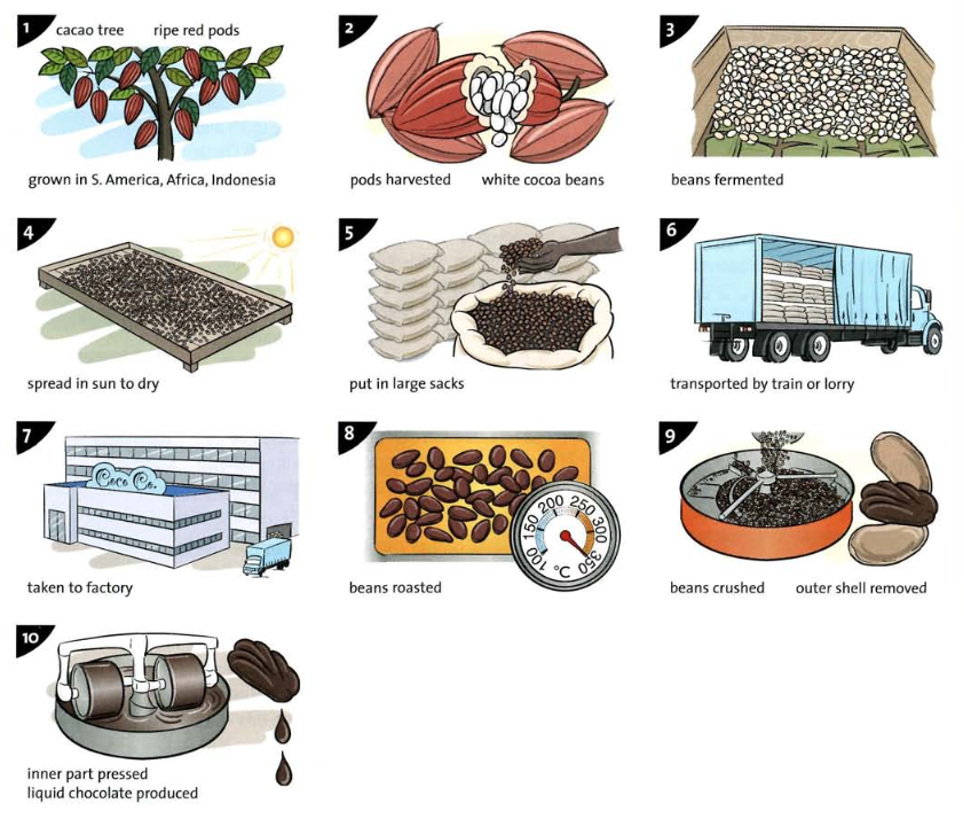
| The illustrations below show how chocolate is produced. Summarise the information by selecting and reporting the main features. |
Dạng bài Process – Đề số 9
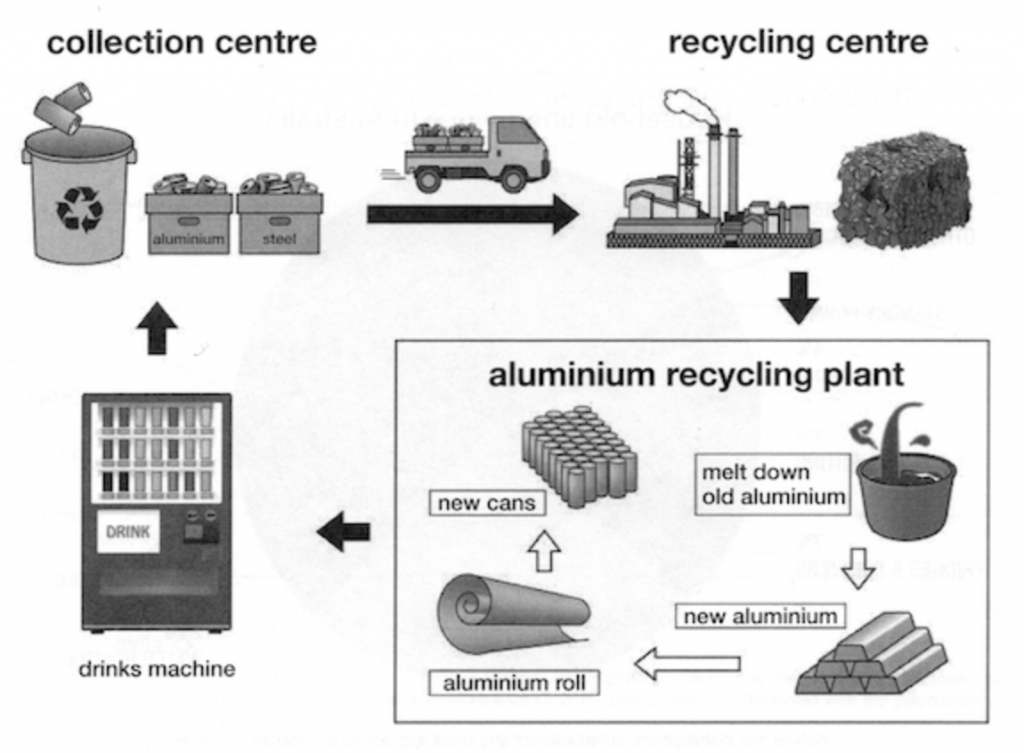
| The diagram below shows the stages in the recycling of aluminium drinks cans. |
Dạng bài Process – Đề số 10
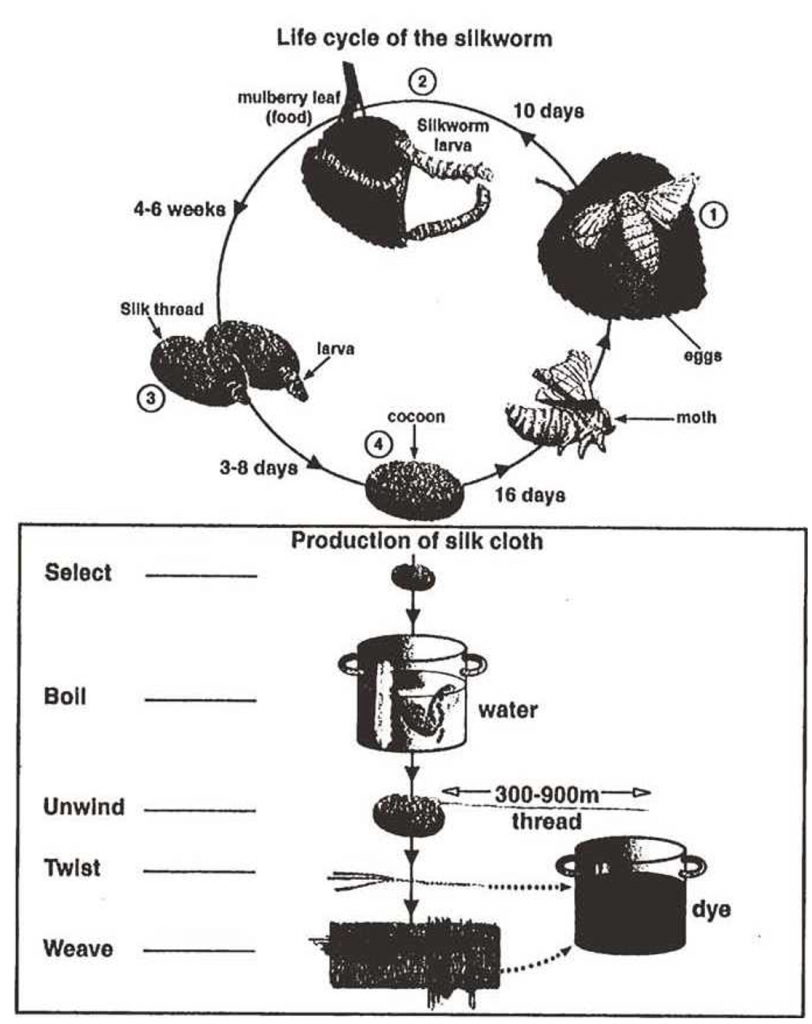
|
The diagrams below show the life cycle of the silkworm and the stages in the production of silk cloth. |
Dạng bài Process – Đề số 11
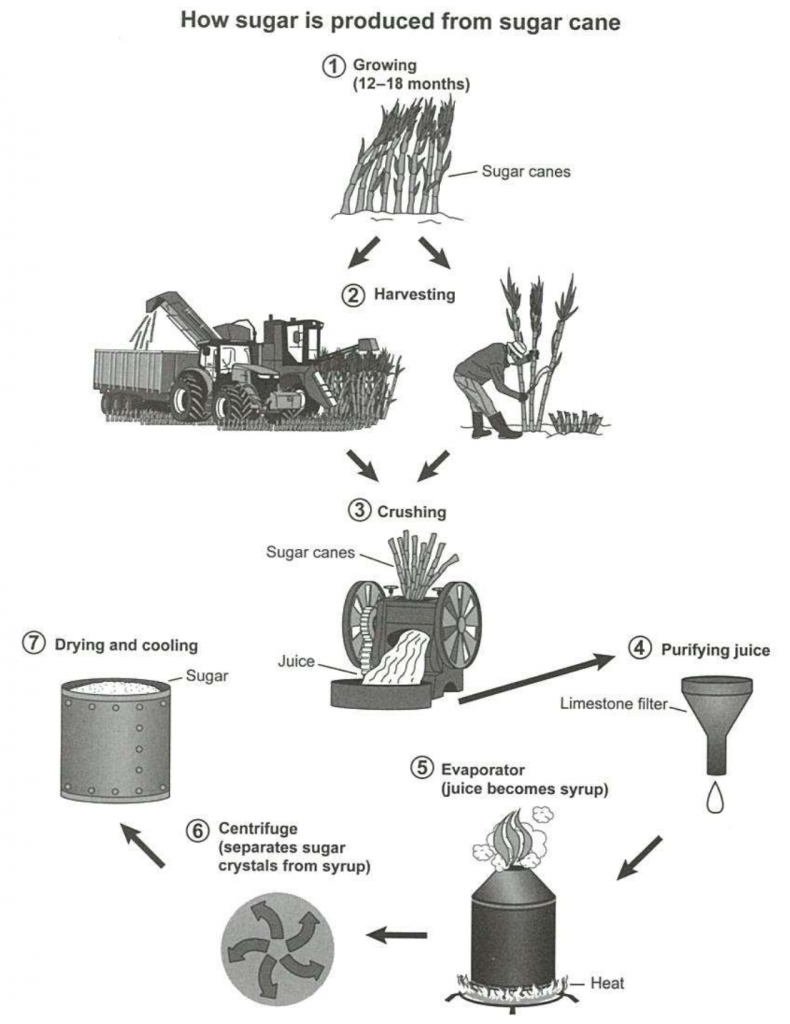
| The diagram below shows the manufacturing process for making sugar from sugar cane. |
Dạng bài Process – Đề số 12
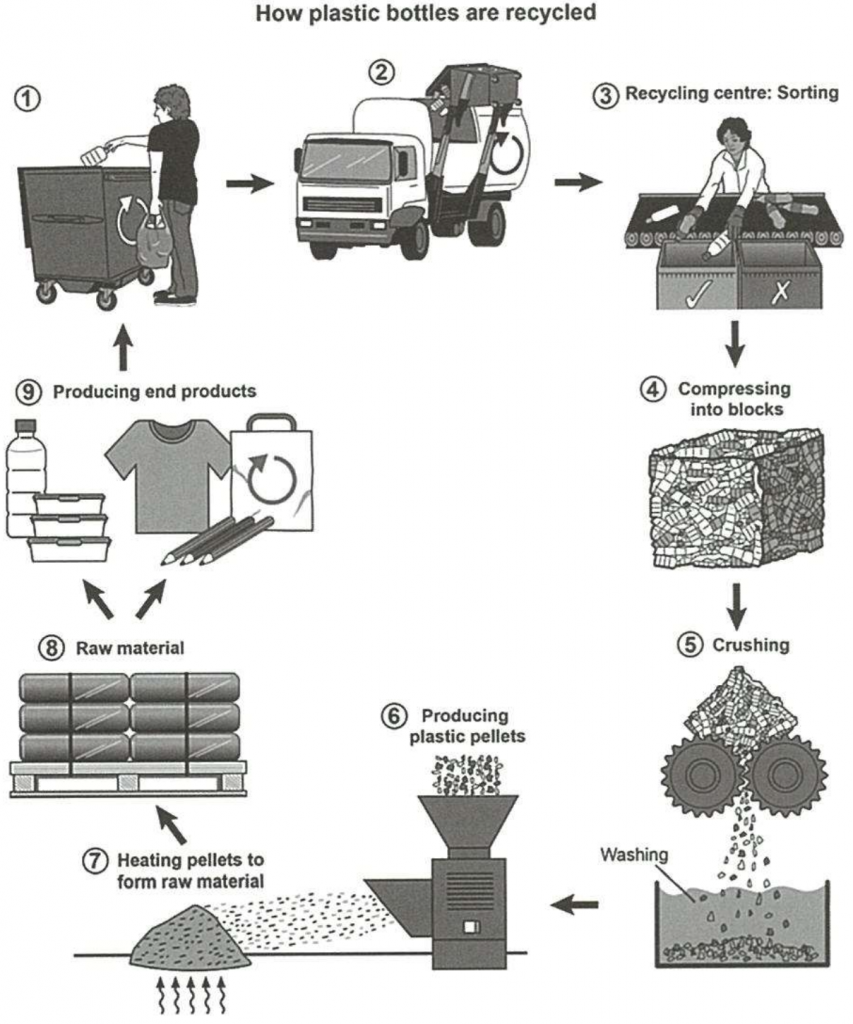
| The diagram below shows the process for recycling plastic bottles. |
Đề IELTS Writing Task 1 – Dạng bài Maps
Theo Thầy đánh giá thì dạng bài Maps khá dễ nhưng cũng giống như dạng bài Process, các thí sinh đa phần đều rất e ngại khi gặp phải đề thi dạng này.
Để nắm được các bước viết dạng bài Maps của Writing Task 1, bạn có thể xem thêm bài viết sau:
Các bước viết dạng bài Maps – Step By Step
Dạng bài Maps – Đề số 1
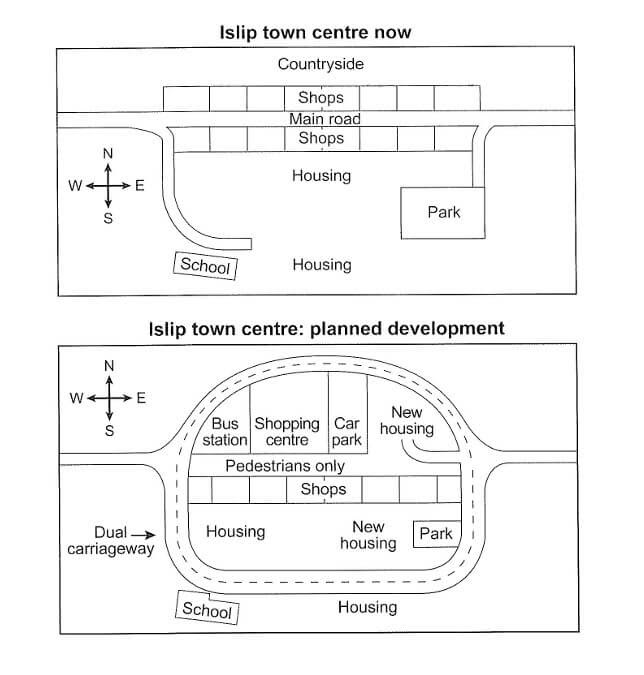
| The maps below show the centre of a small town called Islip as it is now, and plans for its development. |
Dạng bài Maps – Đề số 2
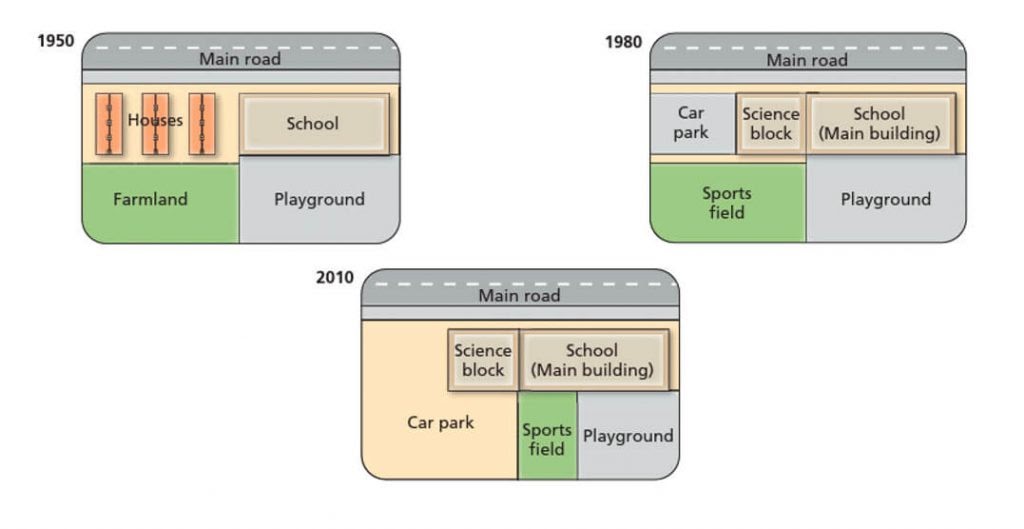
| The diagrams below show the changes that have taken place at West Park Secondary School since its construction in 1950. |
Dạng bài Maps – Đề số 3
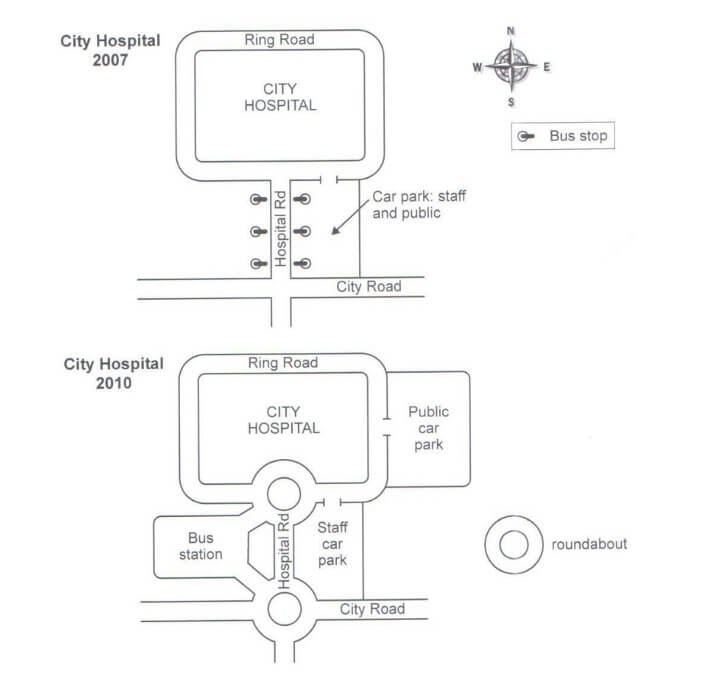
| The maps below show road access to a city hospital in 2007 and in 2010. |
Dạng bài Maps – Đề số 4
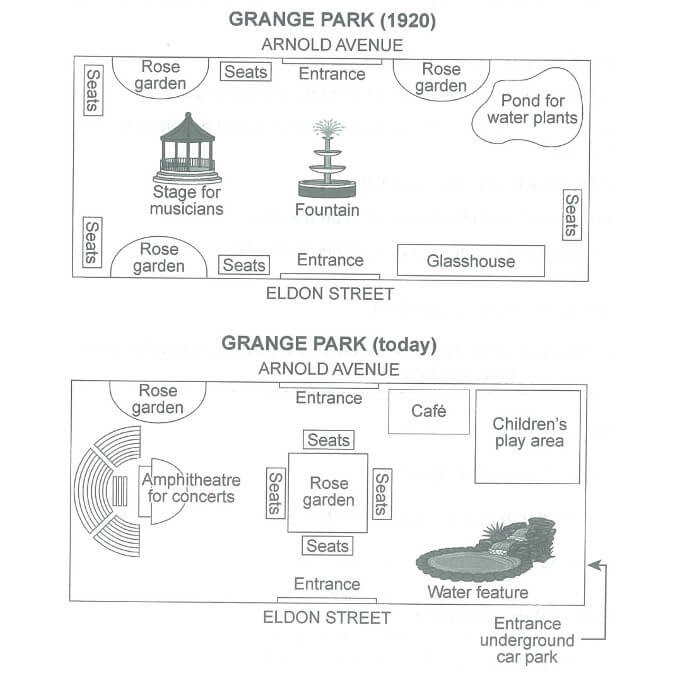
| The plans below show a public park when it first opened in 1920 and the same park today. |
Dạng bài Maps – Đề số 5
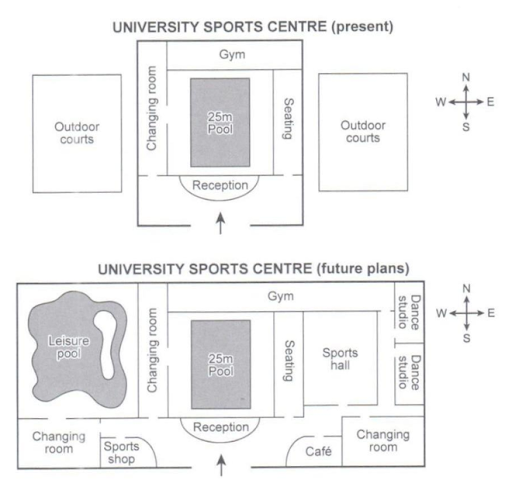
| The plans below show the layout of a university’s sports centre now, and how It will look after redevelopment. |
Dạng bài Maps – Đề số 6
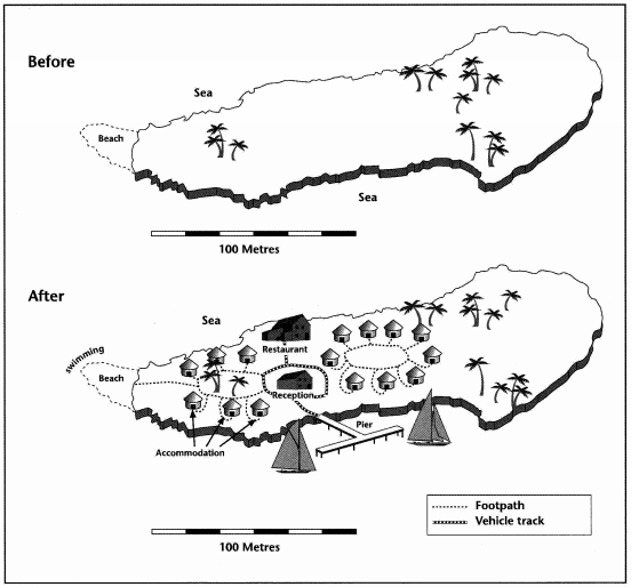
| The two maps below show an island, before and after the construction of some tourist facilities. |
Dạng bài Maps – Đề số 7
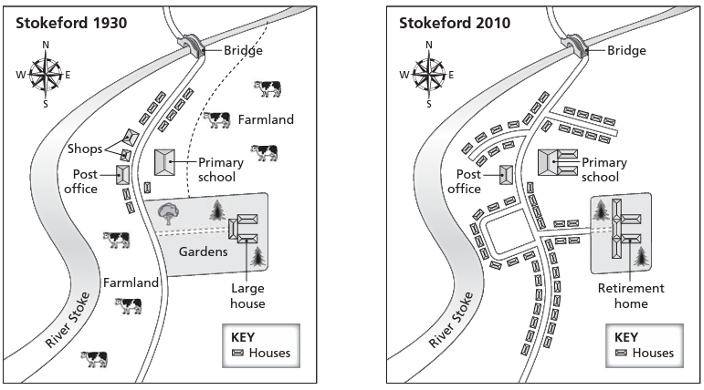
|
The maps below show the village of Stokeford in 1930 and in 2010. |
Dạng bài Maps – Đề số 8
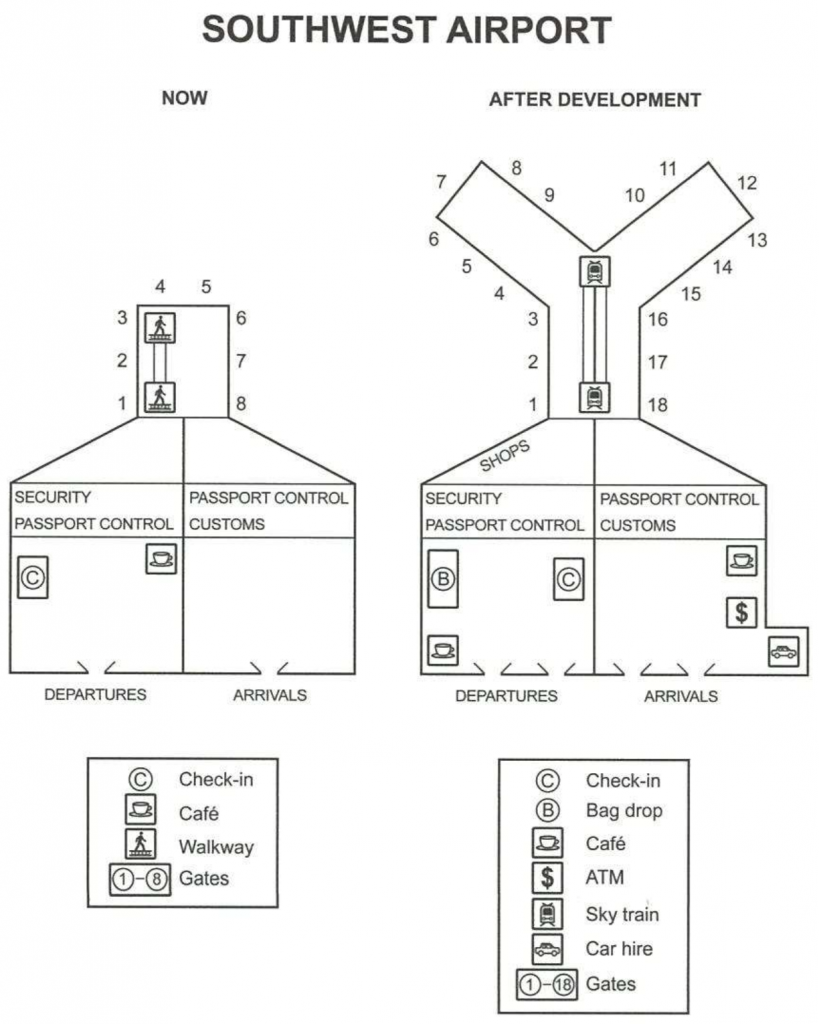
|
The plans below show the site of an airport now and how it will look after redevelopment next year. |
Lời kết
Trên đây là tổng hợp những đề thi IELTS Writing Task 1 nổi bật, bao quát tất cả các dạng câu hỏi của phần thi này. Với mỗi dạng bài, thầy đều đã có những bài viết chuyên sâu, hướng dẫn chi tiết các bước thực hiện, step-by-step.
Chúc các bạn ôn tập thật tốt và đạt kết quả cao trong bài thi IELTS.